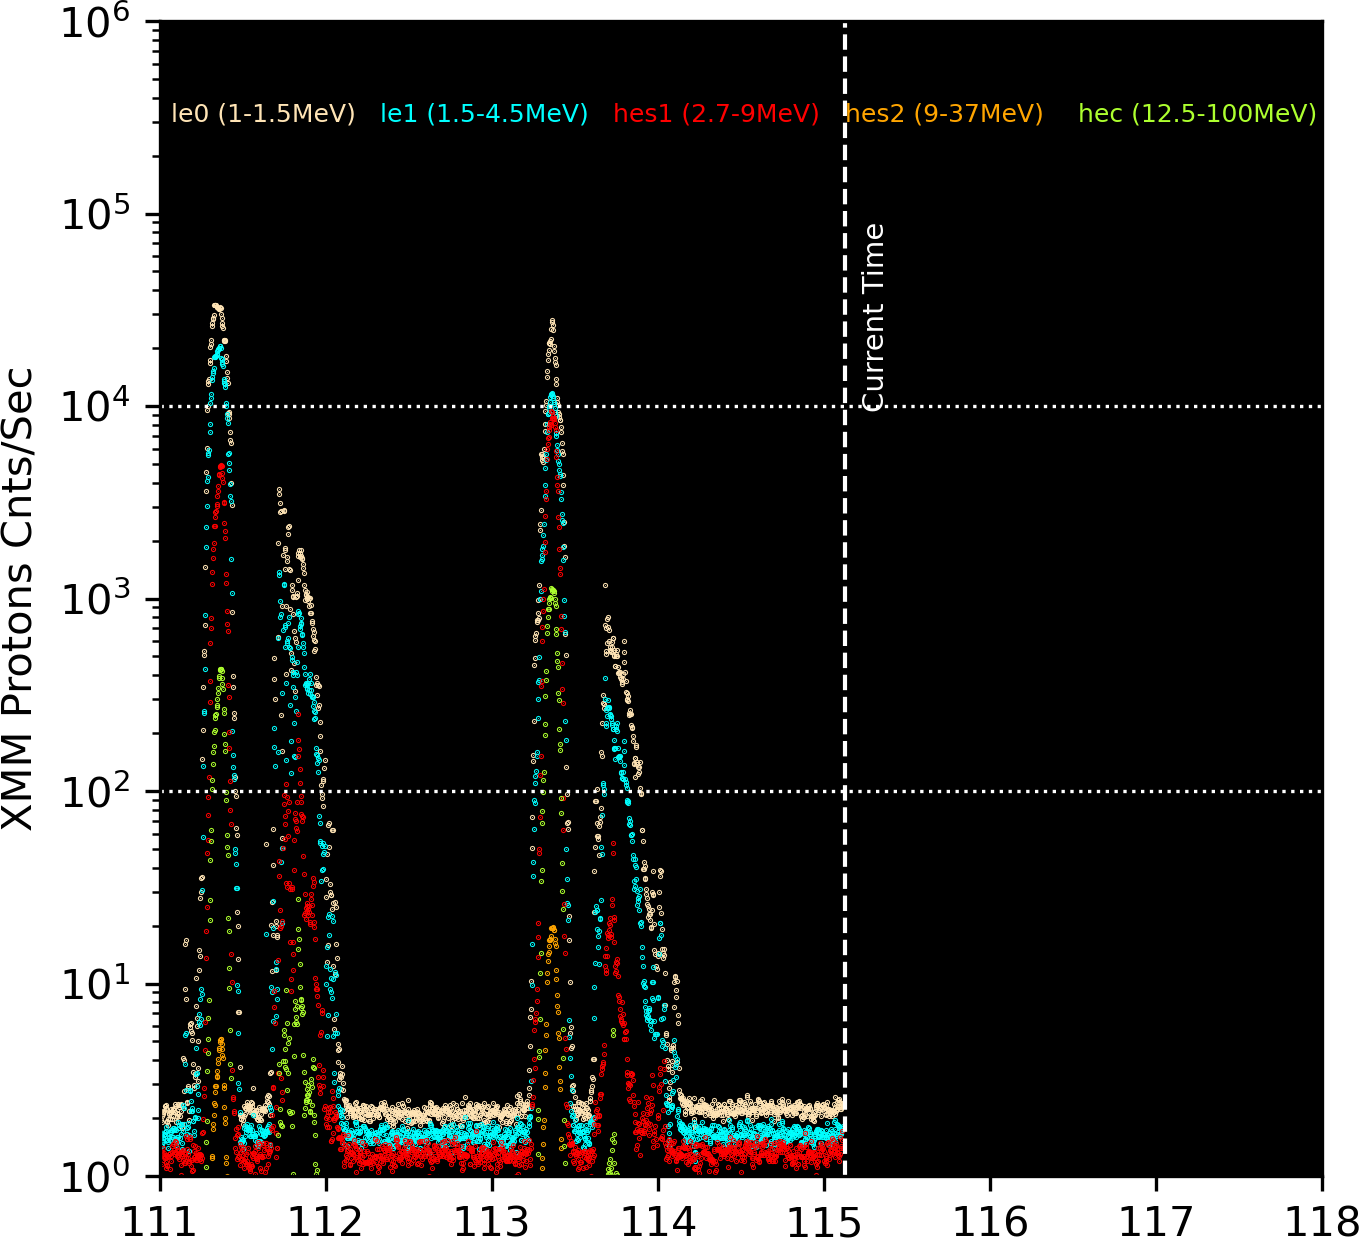

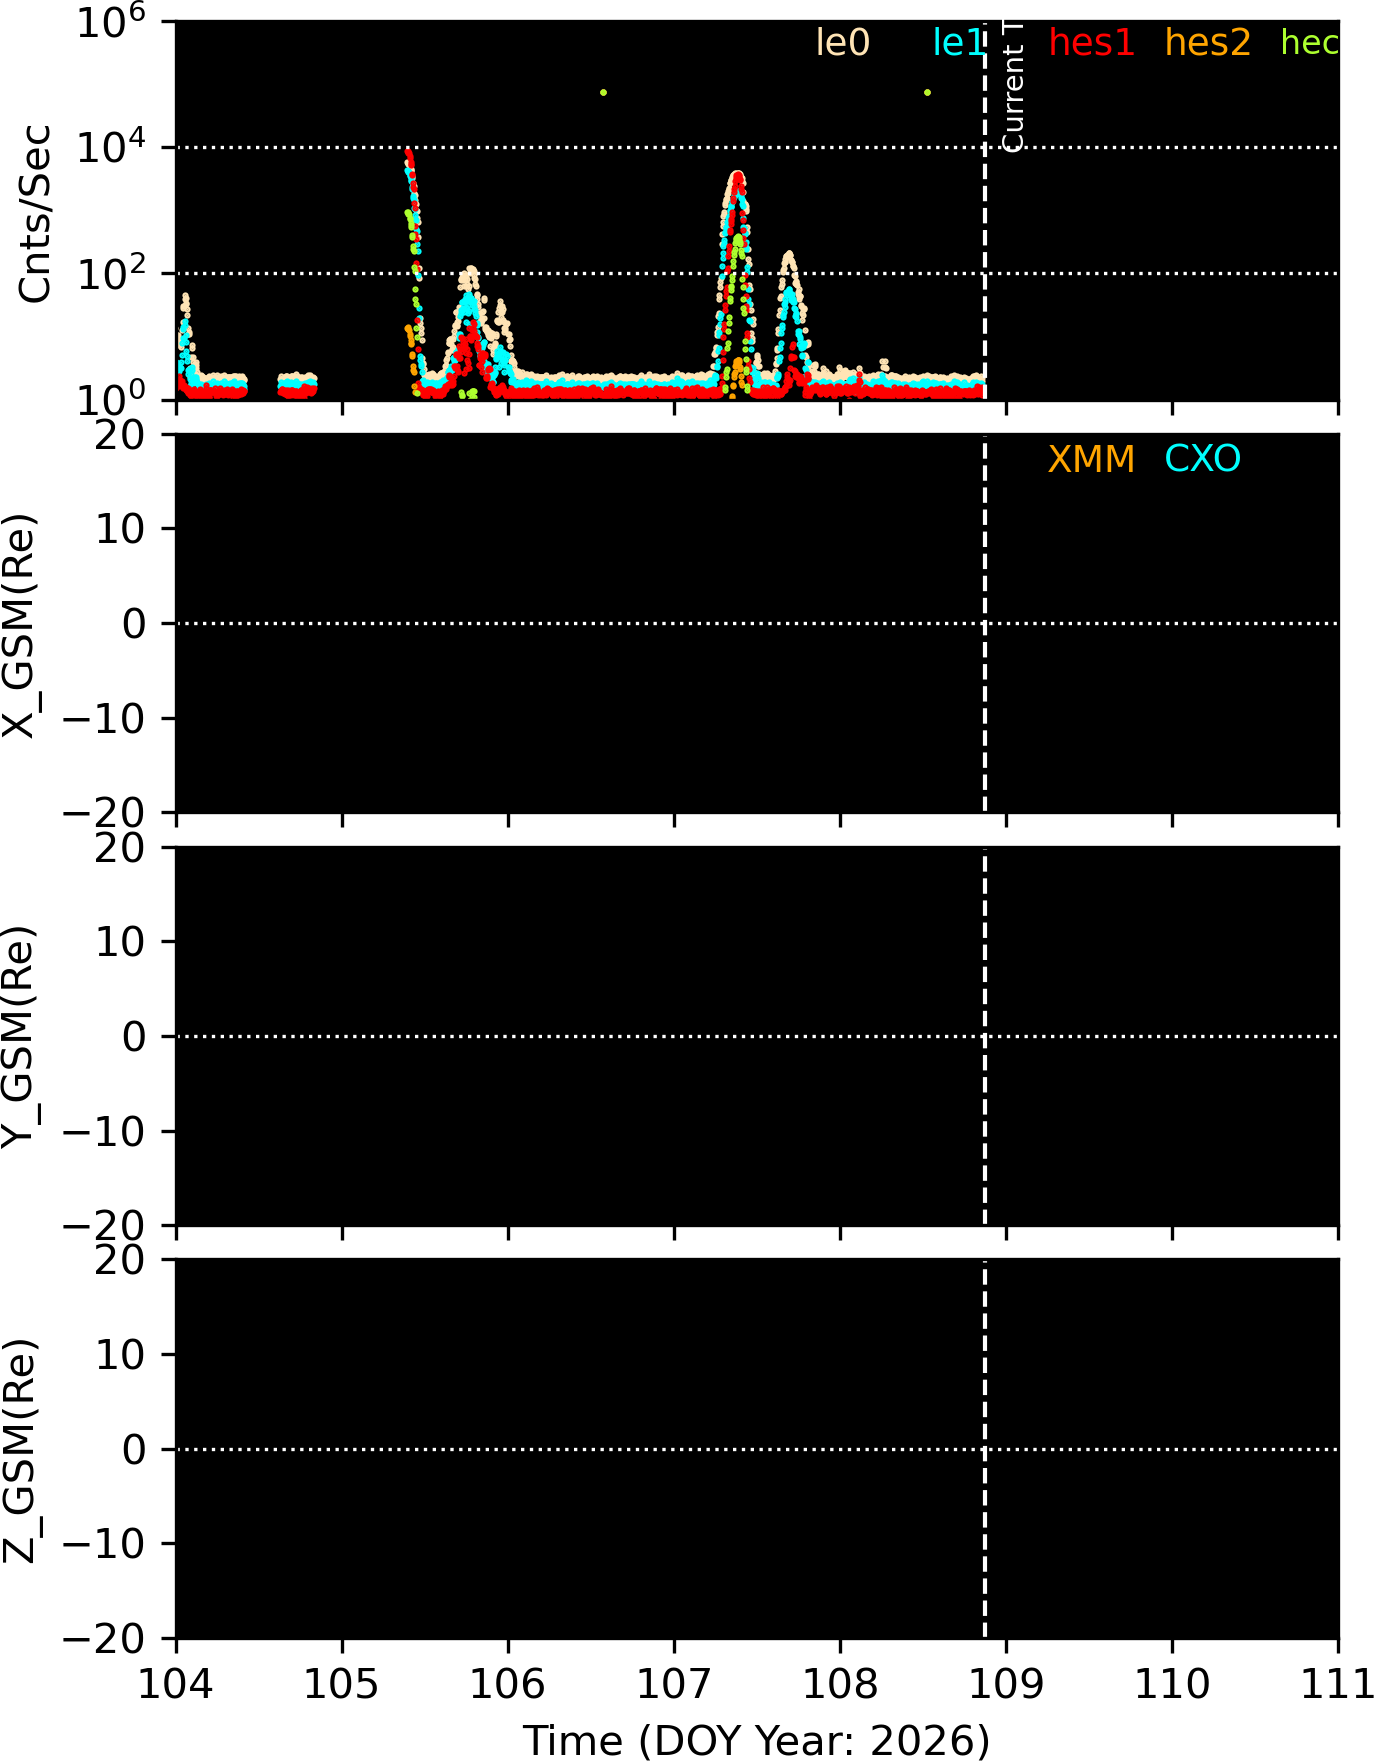
                                        Most recent XMM radiation observations
                                 Differential Flux particles/cm2-s-ster-MeV

 UT Date   Time    ---------------------------------- Protons MeV -------------------------------
                          LE1          LE2         HES1         HES2         HESC
  YR MO DA HHMM          1-1.5       1.5-4.5       2.7-9        9-37       12.5-100
2026-Jul23-14:30        2.356        0.461        1.597        0.485        0.395
2026-Jul23-15:30        1.926        0.435        1.554        0.455        0.377
2026-Jul23-16:30        1.950        0.413        1.514        0.478        0.395
2026-Jul23-17:30        1.903        0.445        1.442        0.493        0.385
2026-Jul23-18:30        1.891        0.438        1.496        0.460        0.392
2026-Jul23-19:30        1.828        0.443        1.518        0.516        0.402
2026-Jul23-20:30        5.349        0.428        1.544        0.475        0.409
2026-Jul23-21:30        2.575        0.459        1.478        0.463        0.394
2026-Jul23-22:30        2.024        0.432        1.524        0.471        0.394
2026-Jul23-23:30        1.853        0.427        1.409        0.480        0.388
2026-Jul24-00:30      177.345        0.462       18.671        0.480        1.450
2026-Jul24-01:30     4422.821        0.533     1481.539        1.171      113.556
2026-Jul24-02:30     7351.712        0.565     2120.730        1.388      156.790
2026-Jul24-03:30     2585.810        0.431      399.442        0.593       26.705
2026-Jul24-04:30        8.239        0.436        1.704        0.482        0.409
2026-Jul24-05:30        2.219        0.422        1.456        0.476        0.376
2026-Jul24-06:30        1.896        0.409        1.480        0.513        0.376
2026-Jul24-07:30        1.975        0.449        1.505        0.472        0.386
2026-Jul24-08:30        3.720        0.447        1.479        0.474        0.383
2026-Jul24-09:30      171.513        0.423        2.257        0.481        0.393
2026-Jul24-10:30      793.478        0.456       11.647        0.477        0.675
2026-Jul24-11:30     1279.261        0.438       30.757        0.473        1.622
The following plots show the orbits of CXO and XMM in GSM coordinates. The left plot is in X-Y plane, and the right plot is in X-Z plane. If the orbit is in green, the satellite is in the solar wind area, if it is in light blue, the satellite is in magnetosheath, and if it is in yellow, the satellite is in magnetosphere.
The periods of the plotted orbits are +/-1.35 days from the current satellite positions (*), and the orange pentagon (*) mark the positions of one day ago.
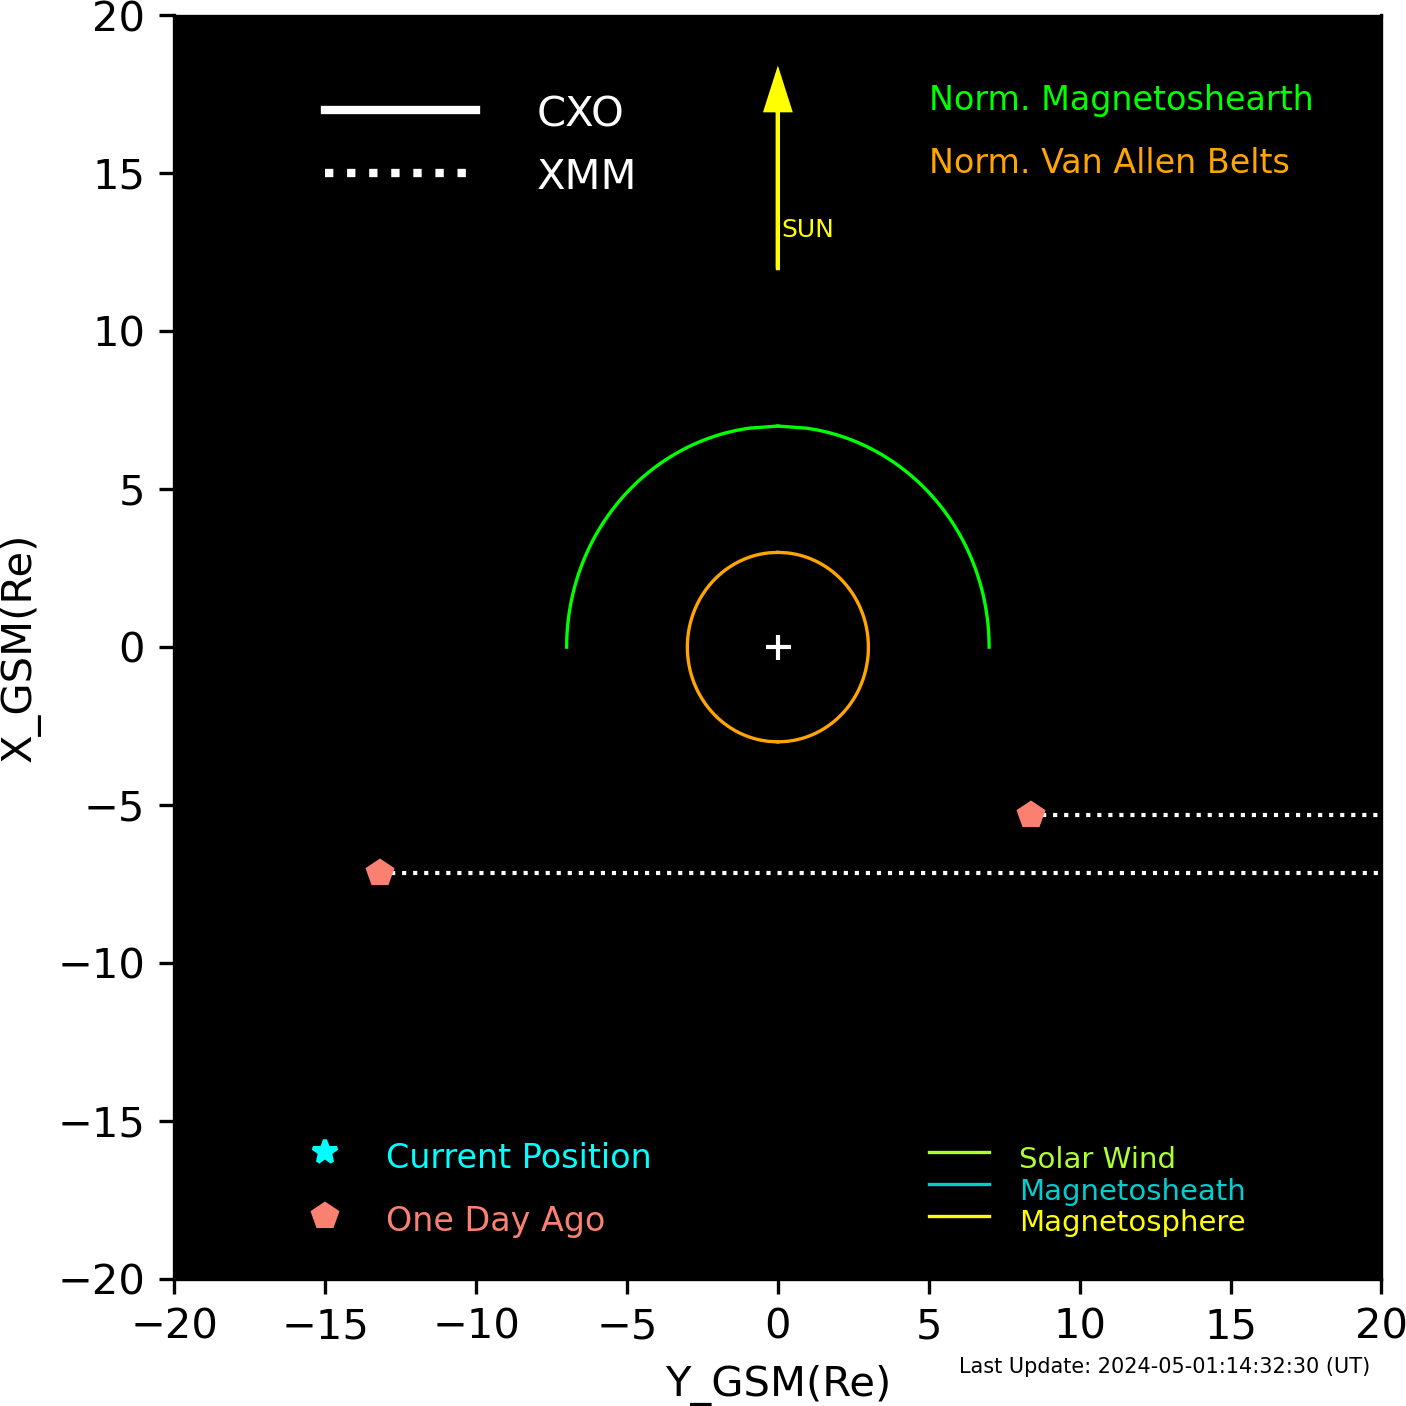
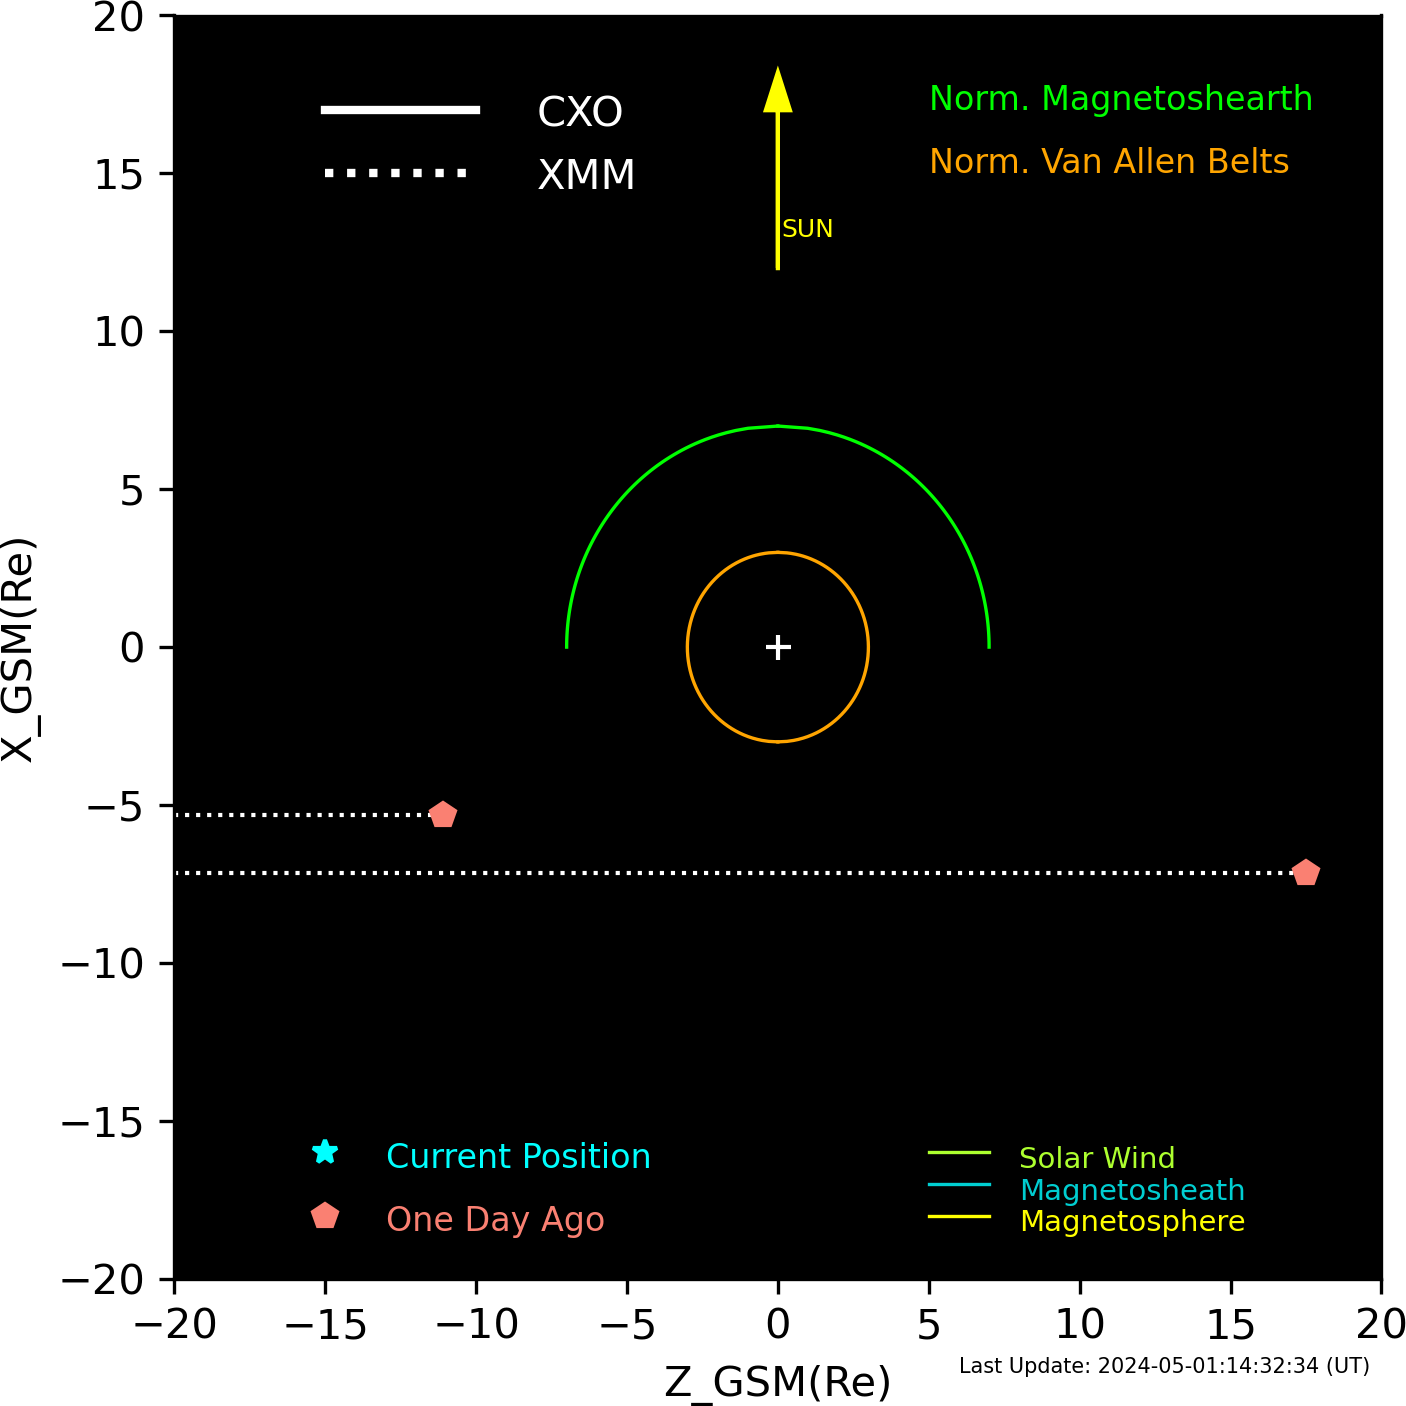
XMM and CXO orbits in GSM coordinates.
Email problems to: swolk
(Scott Wolk)
...it is all his fault