CalDB 4.4.5 Public Release Notes
Public Release Date: 30 JUN 2011
I. INTRODUCTION
CalDB 4.4.5 is an upgrade to the Chandra CalDB, which includes the following items:
- HRC-S Time-displaced QEU maps version N0006
CalDB 4.4.5 also includes all the upgrades included in CalDB version 4.4.4, which was released internally with DS8.4 in standard processing only, on 28 JUN 2011. See the CalDB 4.4.4 Release Notes.
For the CIAO 4.3 / CalDB 4.4.5 release notes see How CIAO 4.3 and CalDB 4.4.5 Affect Your Analysis
II. SUMMARY OF CHANGES
A. HRC-S Time-displaced QEU maps version N0006
| Location: | $CALDB/data/chandra/hrc/qeu/ |
| Filename: | hrcsD1999-01-01qeuN0006.fits hrcsD2000-01-01qeuN0006.fits hrcsD2001-01-01qeuN0006.fits hrcsD2002-01-01qeuN0006.fits hrcsD2003-01-01qeuN0006.fits hrcsD2004-01-01qeuN0006.fits hrcsD2005-01-01qeuN0006.fits hrcsD2006-01-01qeuN0006.fits hrcsD2007-01-01qeuN0006.fits hrcsD2008-01-01qeuN0006.fits hrcsD2009-01-01qeuN0006.fits hrcsD2010-01-01qeuN0006.fits hrcsD2011-01-01qeuN0006.fits hrcsD2012-01-01qeuN0006.fits hrcsD2013-01-01qeuN0006.fits |
Background:
The QEU files are a 3D map of the deviation of the detector QE from the nominal 1D vector of QE vs energy. This 1D vector refers to the 0th order aim point. The three dimensions of the QEU file are then detector x,y and energy. The CIAO software obtains the QE at any detector location and energy by multiplying the nominal QE by the value in the QEU map at that detector location and energy.
QE Decline:
The accumulation of LETG+HRC-S observations of the hot white dwarf HZ43 since launch has revealed a slow decline in the HRC-S QE at a rate of approximately half a percent per year. The decline appears to be a bit faster in the 0th order (aim point) region of the detector than for the regions probed by dispersed photon events. Since the nominal detector QE is a 1D vector, a spatially non-uniform QE decline can only be accounted for in the QEU map.
Because the decline is relatively slow - half a percent or so per year - the decline can be adequately represented by annual QEU files. Each QEU file represents the state of the QE decline over the detector in the year in question. For an observation obtained in a given year, CIAO will then employ the QEU map appropriate for that year. Files are indexed to mid-year, so that the error in QE incurred by the yearly digitization amounts to no more than 0.25% or so.
For more detailed calibration information see the technical details section below.
See the HRC-S QE why page for more information.
PIPELINES/TOOLS AFFECTED:
CIAO 4.3 tool fullgarf for the LETG/HRC-S configuration.
CIAO 4.3 tool mkinstmap for HRC-S.
THREADS AFFECTED:
III. TECHNICAL DETAILS
A. HRC-S Time-displaced QEU maps version N0006
Calibration of the QE Decline:
In order to produce the new QEU files, we analysed all the LETG+HRC-S observations of HZ43, supplemented with observations of Sirius B. Both of these stars should be completely stable in X-ray output, and so provide standard candles for LETGS monitoring.
The count rates obtained in dispersed and 0th order regions were obtained for each observation using standard CIAO processing. Secular decline in QE appears to be linear to within the accuracy of the data. Linear fits to the 0th order and dispersed data provided the rate of QE decline in each region.
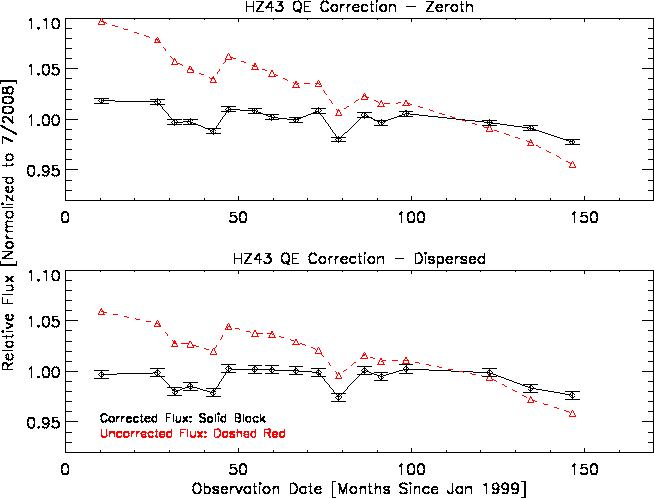
QEU maps were produced to reflect the observed rate of QE decline in the mid-years since the beginning of Chandra observations. Files were placed into the test CALDB, and all observations we re-analysed using CIAO to compute effective areas and derive fluxes for dispersed and 0th order regions. These fluxes were verified to remove the secular QE trend and produce a flat flux vs time.
The bounds of the 0th order region have been reset to S2 chipx = [1776.5, 2416.5], chipy = [8544.5,9312.5]. The results of the analysis are summarised in Figure 1 that shows the HZ43 observations scaled by the effective areas in the current CIAO release, and using the new QEU files in the test CALDB. The secular trend in the scaled count rates is removed for both 0th order and dispersed events.

Fig. 1: Relative fluxes calculated from HX43 observations,
normalized to the July 2008 observation. The values in the upper plot
are for the zeroth order. The values in the lower plot are for the
dispersed spectrum.