CalDB 4.8.1 Public Release Notes
Public Release Date: 25 OCT 2018
Not To Be Installed In SDP
I. INTRODUCTION
CalDB 4.8.1 is an upgrade to the Chandra CalDB, which includes the following items:
- ACIS CONTAM File Version N0012
For the CIAO 4.10 / CalDB 4.8.1 release notes see How CalDB 4.8.1 Affects Your Analysis.
II. SUMMARY OF CHANGES
A. ACIS CONTAM File Version N0012
| Location: | $CALDB/data/chandra/acis/contam/ |
| Filename: | acisD1999-08-13contamN0012.fits |
On-going verifications of the contamination correction with time have revealed recently that the model has been over-estimating the contaminant since early 2018, and that an adjustment is needed to both the ACIS-I and ACIS-S time-dependent models. The corrected model for ACIS-I (CONTAM version N0011) was released in CalDB 4.7.9. As promised with that release, the ACIS Calibration Team has developed a modified ACIS-S contamination model as test version, copied to CalDB CONTAM version N0012. That new model includes a more complicated time-dependence in the layers corresponding to the different identified chemical elements in the contaminant, namely C, O, and F.
In the previous releases, the layers corresponded to specific elements known to be present in the contaminant: C, O, and F. However, the layers actually represent the different spectral absorption models of the components of the contaminant. The details of the absorption model depend on the chemical bonding of the molecules that comprise the material but because it is now clear that there are (at least) two different components with different C:O:F ratios, the molecules are not likely to have the same bonding structure. The near edge structure of the absorption model is particularly sensitive to the types of bonds and the transmission grating spectra now show that the F-K and O-K near edge structures are time-dependent. To avoid excess absorption near the edge, one layer each of F and O were added that have no near edge structure and these simple, Henke-like edges have been assigned different time dependencies than the versions of the F and O opacities that have clear structure near the edges.
Hence the new ACIS-S contamination model includes two additional rows of data values in the tau0 and tau1 arrays, which include the opacities for F and O with no near-edge structure. See the technical details section below for further information on the upgrade to the ACIS-S model, as well as the updated time base.
See the why page for more general information on the ACIS OBF.
CIAO SCRIPTS/TOOLS AFFECTED:
See the script fluximage, which uses mkinstmap
See the script specextract, which uses mkwarf
See the script fullgarf, which uses mkgarf
THREADS AFFECTED:
For exposure-corrected imaging analysis with ACIS, see the threads:
- Single Chip ACIS Exposure Map and Exposure-corrected Image
- Multiple Chip ACIS Exposure Map and Exposure-corrected Image
For imaging spectroscopy with ACIS, see the threads:
- Extract Spectrum and Response Files for a Pointlike Source
- Extract Spectrum and Response Files for an Extended Source
- Extract Spectrum and Response Files for Multiple Sources
For grating spectroscopy with ACIS, see the threads:
III. TECHNICAL DETAILS
A. ACIS CONTAM File Version N0012
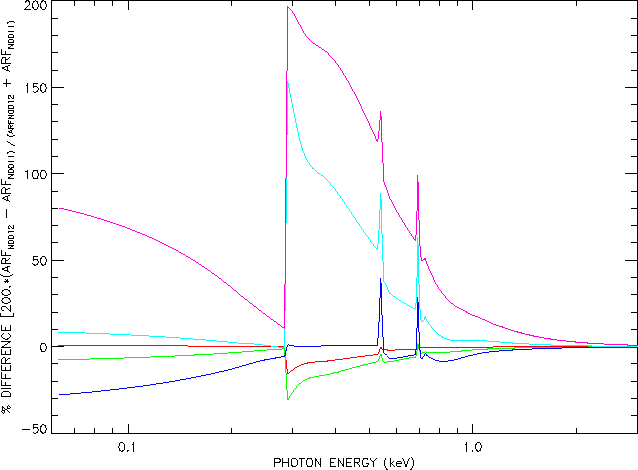
For the ACIS-S aimpoint effective area (EA) versus time, see Fig. 1 below, where the EA is plotted for May 15th (mid-cycle date) of years 2000, 2010, 2016, 2018 (~current date), and 2019 (predictive), for the current (version N0011, solid) and new (N0012, dashes) CONTAM files. The percent difference curves for each case are given in Fig. 2. While there are retro-active changes to the resulting EAs, they are not significant for purposes of fitting/derived parameters. However, as of early 2018, the new file begins significantly to address the over-estimation of the CONTAM effect that has been evident in the most recent observations.

Fig. 1: ACIS-S3 aimpoint effective area for mid-cycle (May 15) from years 2000 (red), 2010 (green),
2016 (blue), 2018 (cyan), 2019 (magenta). The solid curves were generated using CONTAM version N0011
(current file), the dashed curves with the new version N0012 file.

Fig. 2: Percent differences between ACIS-S3 aimpoint effective areas generated with CONTAM N0011 vs CONTAM N0012,
shown in Fig. 1 above, with the same color associations. A positive value indicates that the N0012 EA has a reduced
contamination effect compared with the N0011 EA.