CalDB 4.7.3 Public Release Notes
Public Release Date: 15 DEC 2016
SDP Installation Date: 2016-12-13T14:15 (UTC)
I. INTRODUCTION
CalDB 4.7.3 is an upgrade to the Chandra CalDB, which includes the following items:
- ACIS T_GAIN Epoch 65+66
- ACIS CONTAM Version 10
- HRC-I GMAP for 2016
- HRC-I PI BKGRND Spectrum 2016
- Correction to HRC-S 2019 QEU Headers
- Cycle 19 PIMMS Effective Areas
For the CIAO 4.9 / CalDB 4.7.3 release notes see How CalDB 4.7.3 Affects Your Analysis.
II. SUMMARY OF CHANGES
A. ACIS T_GAIN Epoch 65+66
| Location: | $CALDB/data/chandra/acis/t_gain/ |
| Filenames: | acisD2015-11-01t_gainN0005.fits acisD2015-11-01t_gainN0006.fits acisD2016-02-01t_gainN0002.fits acisD2016-02-01t_gain_biN0002.fits |
A new ACIS time-dependent gain correction update has been released by the calibration team. Due the natural time decay of the ACIS External Calibration Source (ECS), counting statistics have become sufficiently poor that it will hereforward be necessary to combine two epochal periods to generate a reliable T_GAIN correction. Hence, the ACIS T_GAIN updates will occur semi-annually rather than quarterly.
For the current release, ACIS epochs 65 (Feb-Apr 2016) and 66 (May-Jul 2016) have been analyzed and reduced to a single set of gain correction data. In keeping with the CalDB T_GAIN file standard, the new T_GAIN files above are built in exactly the same fashion as before, with one exception: The EPOCH1 and EPOCH2 header keywords, which provide the interpolation limits in time for the software to use to adjust the gain correction values, are now to be set to the mid point of the merged two epochs, that is, the time point half way between the beginning of the first epoch, and the end point of the second epoch. In the current case of epochs 65 and 66, the midpoint is 2016-05-02T00:00:00 (UTC) or 578534468.184 (MET).
Despite the fact of combining the two epochs 65 and 66, and using a 6-month update period, the new T_GAIN corrections for the combined epochs are very similar in magnitude to the previous quarterly corrections. As always, users with datasets having DATE-OBS later 2015-11-01T00:00:00 are encouraged to reprocess their data using chandra_repro with the latest CalDB update (4.7.3) installed. For illustrations of the new corrections, see the T_GAIN technical details section below.
Hence we are at length able to release finalized versions (N0005 and N0006) of the Epoch 64 T_GAINs,
namely,
acisD2015-11-01t_gainN0005.fits
acisD2015-11-01t_gainN0006.fits
which had been released as "provisional" files (version N0002) with CalDB 4.7.1 in March of 2016.
Their finalization has been
delayed due to the poor statistics in Epoch 65, preventing finalizing Epoch 64 during the previous
quarter. Instead we have waited for Epoch 66 (May-Jul) to be completed, and for new statistical
methods to be implemented to derive corrections when statistics are degraded. Users with
observations taken after (DATE-OBS later than) 2015-11-01T00:00:00 should consider reprocessing
their data with these newly-released T_GAIN corrections.
See the ACIS time-dependent gain why page for more information.
PIPELINES/TOOLS AFFECTED:
DS and CIAO level 1 (re)processing tool acis_process_events
Also: CIAO reprocessing script chandra_repro
THREADS AFFECTED:
Reprocessing Data to Create a New L2 Events File
B. ACIS CONTAM Version 10
| Location: | $CALDB/data/chandra/acis/contam/ |
| Filename: | acisD1999-08-13contamN0010.fits |
The latest results of ACIS contamination monitoring and modeling has determined there is a need for another short-term update for the ACIS CONTAM model file in CalDB. As such, a new file is being released in CalDB (specifically version N0010) with the updated contamination spatial and temporal models included. The new CONTAM file when used as the default allows improved fits to standard extended source spectra with stable photoabsorption and and other fitted parameters of their systematic models. The new model is applicable to ALL ACIS observations throughout the mission, and is intended to replace all previous versions (including the previous version N0009); Use of the new model will have no significant effect on fitting results for observations preceeding 2009.
A detailed presenation of the derivation of the new model, and the resulting changes in the estimated effective area of ACIS-I and ACIS-S as a function of time, are reserved for the technical details section for CONTAM N0010 below. Users with data in the affected time periods should consult the section below and consider reanalyzing their data with the new CONTAM installed in their local CalDB. Because of the latest adjustments to the model, there is no simple statement we can make regarding its affect on any particular users' results.
See the ACIS QE contamination why page for more information.
PIPELINES/TOOLS AFFECTED:
The following CIAO tools are affected when detsubsys is defined to include ACIS or any part of ACIS:
mkarf
mkwarf
mkgarf
fullgarf
THREADS AFFECTED:
IMAGING Spectroscopy threads:
Extract Spectrum and Response Files for a Pointlike Source
Extract Spectrum and Response Files for an Extended Source
Extract Spectrum and Response Files for Multiple Sources
Grating Spectroscopy threads:
HETG/ACIS-S Grating ARFs
LETG/ACIS-S Grating ARFs
C. HRC-I GMAP for 2016
| Location: | $CALDB/data/chandra/hrc/gmap/ |
| Filename: | hrciD2016-09-20sampgainN0001.fits |
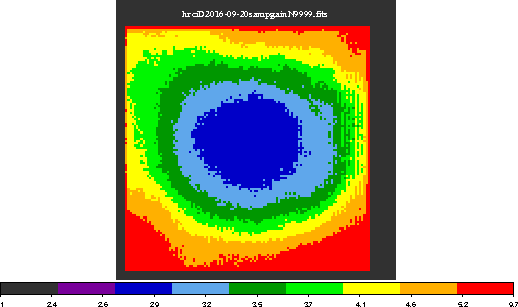
The September 2016 adjustment to the HRC-I time-dependent gain map has been calibrated and has been released. The rate of gain decay continues to increase with time; however the HRC calibration team has determined that an annual GMAP adjustment is adequate to maintain approximately 2-4% global accuracy in the gain. The same set of ArLac observations has been used to measure the gain corrections. Details including a plot of the new GMAP and its differences with the previous corrections for 2015 are included in the technical details section below.
As with previous HRC-I GMAP updates, these changes will apply only to recent HRC-I observations, specifically those with DATE-OBS later than 2016-09-20T12:00:00 UTC.
See the HRC-I gain map why page for more information.
PIPELINES/TOOLS AFFECTED:
DS and CIAO level 1 (re)processing tool hrc_process_events
Also: CIAO reprocessing script chandra_repro
THREADS AFFECTED:
Reprocessing Data to Create a New L2 Events File
D. HRC-I PI BKGRND Spectrum 2016
| Location: | $CALDB/data/chandra/hrc/pibgspec/ |
| Filename: | hrciD2016-09-20pibgspecN0001.fits |
Along with the new 2016 HRC-I GMAP, the incumbent PIBGSPEC for September 2016 is also being released. The PI background spectrum changes with the GMAP, because background events reprocessed using the new GMAP, using the point-source observations as are used to generate the new GMAP. This results in a shift in the background spectrum in channel space relative to the previous spectrum file. Details of how the derivation is done, and a plot of the new spectrum in comparison with previous PIBGSPEC files are given in the technical details section below.
PIPELINES/TOOLS AFFECTED:
CIAO tool hrc_bkgrnd_lookup.
THREADS AFFECTED:
HRC-I Background Spectra Files
E. Correction to HRC-S 2019 QEU Headers
| Location: | $CALDB/data/chandra/hrc/qeu/ |
| Filename: | hrcsD2019-01-01qeuN0007.fits |
The CalDB Manager has discovered that the projected QEU for year 2019 for HRC-S has header errors in Blocks 2 and 3 of the file. Specifically, the keywords CVED0001 and CVET0001 had been assigned when the file was first built. However, since it is a last-in-line file, there is no need for a validiy end date until later-year projected QEU files emerge in CalDB. The CVED0001 and CVET0001 were deleted from Block 2 upon release in the CalDB in December 2014. However, they were not deleted in Block 3 or 4. That has been remedied in the CalDB 4.7.3 release.
PIPELINES/TOOLS AFFECTED: NONE
THREADS AFFECTED: NONE
III. TECHNICAL DETAILS
A. ACIS T_GAIN Epoch 65+66
The ACIS T_GAIN epoch 65+66, combining two quarterly epochs, and covering the period of Feb through Jul 2016 has recently been completed, and the ACIS External Calibration Source (ECS) radiation zone data has been reduced as per some modified procedures, to generate the time-dependent gain correction tables for this epoch. The procedural modifications were made to address the decreasing statistics available from the ECS due to its natural decay in count rates. The two epochs are being combined to produce a single new T_GAIN correction update.
The original method of derivation for the ACIS T_GAINs is given in the memorandum "Corrections for time-dependence of ACIS gain", posted on ACIS Calibration web page ACIS TGAIN.
According to R. Nick Durham: Changes were made to the ACIS TGAIN correction method to account for the dimming ECS X-ray source. Improvements to the method result in increases in the consistency and accuracy of event energies as a function of chip(x,y) position.
- Statistical fitting models improved for low counts.
- I-array and S2 chips are most effected due to the reduced amount of exposure time on these chips and their high-resolution 32x32 pixel TGAIN fitting regions. The high-resolution S3 chip is less effected due to the much greater ECS exposure time available.
- Low energy TGAIN corrections are more greatly effected than high energy due to the relative strengths of the Al, Ti, and Mn ECS lines.
- High chipY rows are more effected due to worsening fitting statistics from the broader high chipy response function.
The magnitudes (in eV) of the new gain corrections, versus photon energy, are given in Figs. 1-3 below. The corrections are of the usual order in magnitude, specifically less than 2.0% of the photon energy value. Fig. 1 below gives the corrections for the ACIS-I aimpoint on chip ACIS-3, for the CTI-corrected case, which is the only one applicable to FI chips. Figure 2 gives the corrections for the ACIS-S aimpoint on ACIS-7, for the case where the BI chips are CTI-corrected. Finally Fig. 3 gives the corrections for ACIS-7 for NON-CTI-corrected BI chips. These would be relevant to GRADED DATAMODE observations with ACIS-S, for example.
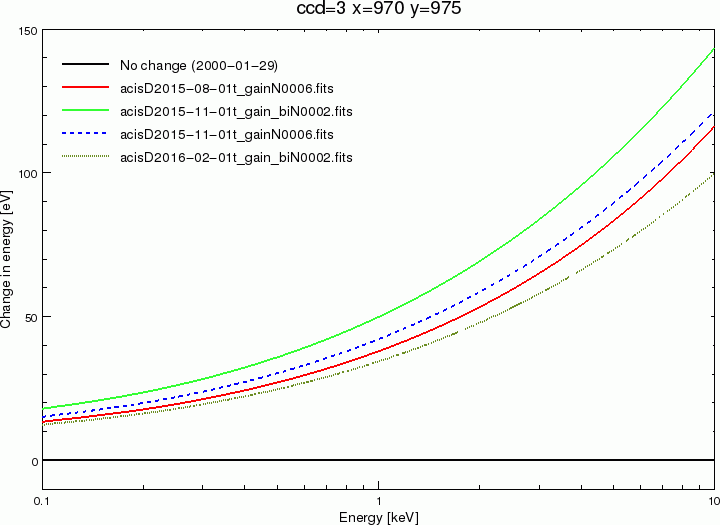
Fig. 1: Time dependent gain corrections versus photon energy for the ACIS-I aimpoint on
ACIS-I3 (CHIPX=570, CHIPY=575) for the new and recent comparable T_GAIN files in CalDB.
The parallel CTI correction for the FI chips has been applied to all data.
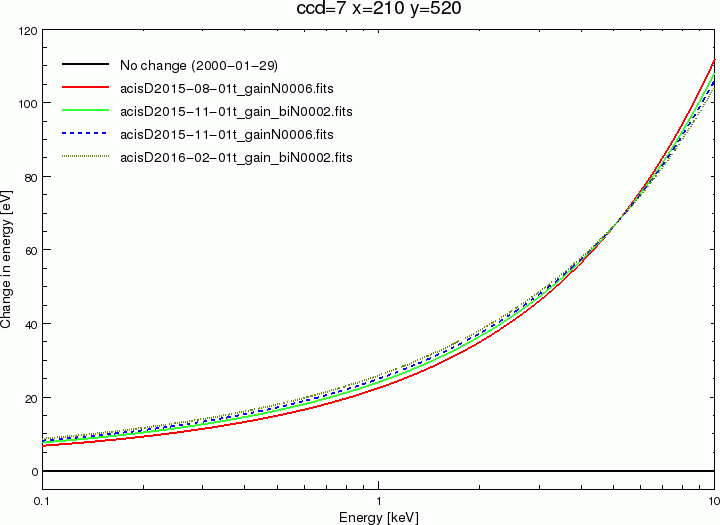
Fig. 2: Time-dependent gain corrections versus energy for the ACIS-S aimpoint on ACIS-7
(CHIPX=210, CHIPY=520) for the new and recent comparable CalDB T_GAIN files. For these data,
the series and parallel CTI correction for the BI chips has been applied.

Fig. 3: T_GAIN correctons versus energy for the ACIS-S aimpoint on ACIS-7, this time with
no CTI correction applied to the data, as would be the case for GRADED DATAMODE observations.
Long term trends for chips I3 and S3 are plotted below in Figure 4a and b, through Epoch 66, which includes the latest release. The chip locations for these plots are given in the respective labels above the plots. Note that the locations are not the aimpoint positions, as with Figs. 1-3 above, but are near the centers of each chip. The full CTI correction has been applied to the data in both figures.
B. ACIS CONTAM Version 10
The contamination layer continues to grow at an accelerated rate, as shown in terms of the optical depth of Carbon K-edge in Figure 5 below. The chemical composition of the layers on ACIS-I and ACIS-S both show variation with time and location on the detector filters, so that a simple fixed model in either case is not adequate, particularly for recent observations (since 2014). There has been a known need to update the CalDB contamination model file (currently version N0009) for more than a year.
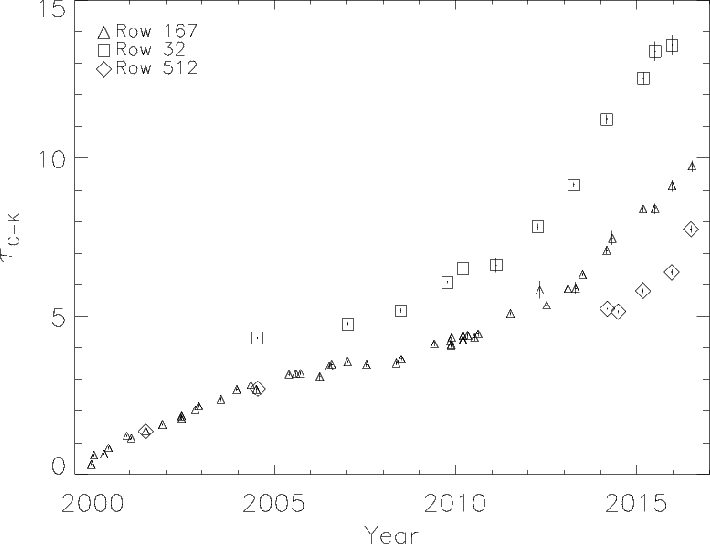
Fig. 5: ACIS-S Carbon K-edge optical depth τ versus time in calendar years. The rate of deposition continues
to increase into the current year.
The ACIS Calibration team has developed a new model for the ACIS CONTAM QE degradation. This new model, included in the CalDB CONTAM N0010 file, includes new time-dependence and spatial variation of the several components (C, O, F) known to dominate the chemical composition of the contaminating layer on the ACIS OBF. The model was developed in a systemmatic procedure, using observations of standard sources A1795 and Mkn421, on ACIS-I and ACIS-S separately. An important step in the procedure was to artificially reduce the depth of the Carbon K-absorption edge, while holding the degree of absorption for the other components more or less the same as in the N0009 model for energies beyond about 0.530 keV. Subsequently the model was tested against the current archival database of SNR E0102-72.3 low-energy source imaging observations.
The new model fits most Calibration observations taken since 2015 considerably better than the previous (version N0009) one. In particular, the spatial model is much improved, giving far more consistent results at off-axis pointings for 1E0102-72.3 on both ACIS-I and ACIS-S. The problem pointings on ACIS-S3 have been at high-CHIPY locations, and these are much better fit with the new model, which allows for asymmetry in CHIPY on the ACIS-S contamination layer.
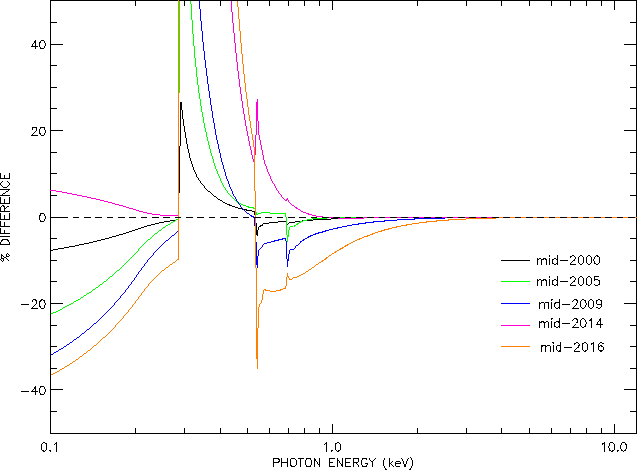
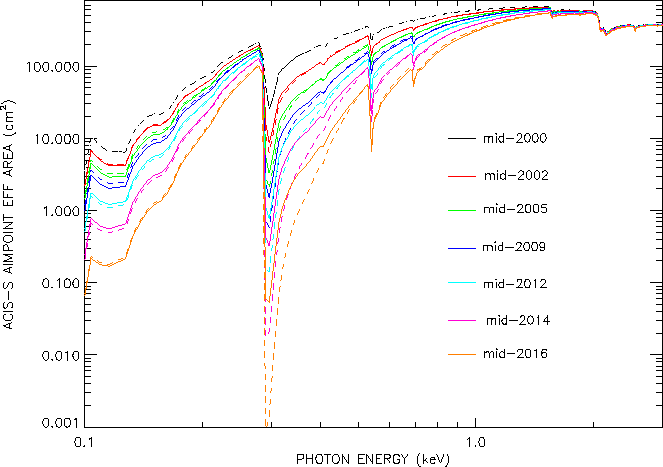
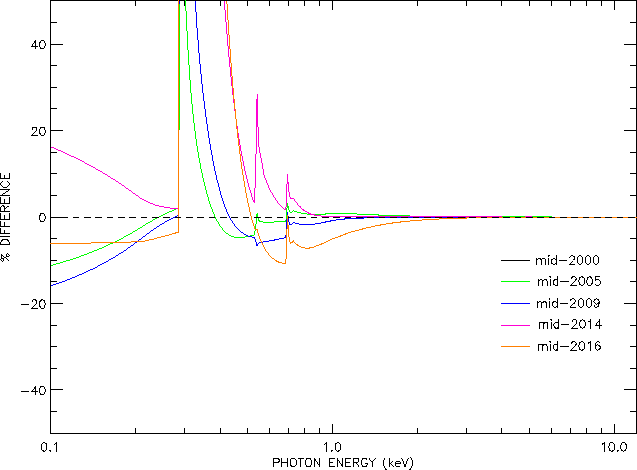
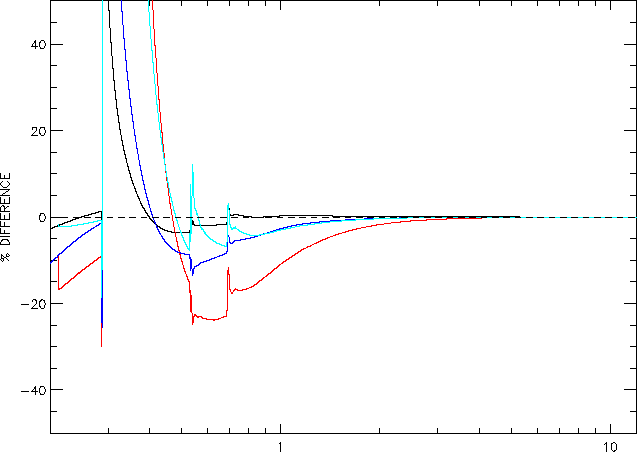
The most succinct way to illustrate the variations between the N0009 and N0010 CONTAM models is to plot comparisons of the effective areas at ACIS-I and ACIS-S aimpoints, and for the ACIS-S/LETG configuration, for specific dates in the mission history. Hence we present the ARF plots and corresponding difference plots in the following six figures.
Summarizing the above for users, the new model does have retroactive affect on the ACIS effective areas for earlier observations. While there is minimal change between the N0009 and N0010 models before 2005, this cannot be said for subsequent dates, particularly near and below the Oxygen K-edge at 0.535 keV. The affect of the contamination is essentially gone above 2.0 keV in any case, however the new CONTAM will affect modeling results for most any low-energy source with a DATE-OBS later than 2005.
The degree of such a change on results for various source models is hard to estimate without any particulars. For the history of calibration observations of SNR E0102-72.3, the improvement in fitting results throughout the mission has been quite positive, giving reduced fitting errors and giving more consistent fit parameter results between off-axis and on-axis observations, and a better performance of source models as the contaminant layer depth has increased. Users' mileage may vary.
It is therefore suggested that users doing or having done spectral analysis of observations with earlier ACIS CONTAM models, where a significant portion of the considered spectra are below 1.0 keV, may have an interest in repeating their older studies with the new CONTAM model applied in their ARFs/GARFs. We at CXC expect to see improvements in general with the new CONTAM applied.
C. HRC-I GMAP for 2016
The HRC-I gain continues to decline, and at a somewhat accelerated rate since 2010. The Calibration Team is monitoring the situation. At this time, no decision has been made regarding any HV adjustment to recover the detector performance. Figure 12 gives the averaged annual gain correction as a function of time, resulting in the approximately annual updates to the HRC-I gain correction maps (GMAP files), including the new GMAP for September 2016 included in this CalDB release (4.7.3).

Fig. 12: Illustration of the HRC-I gain correction factor versus time in calendar years.
T new HRC-I GMAP generated for the (UTC) period 2016-09-20T12:00 to the present, and extending into 2017 is shown in Figure 14a below, with the ratio of the new map to the 2015 map given in Fig 14b. The corrections were generated using G21.5-0.9 and HZ 43 calibration observations taken regularly to monitor HRC-I, combined with a sequence of ArLac observations at 21 specific locations on HRC-I, taken annually. See Figure 13 below for the positions of the on axis pointing, and the 20 off-axis pointings of AR Lac. The procedure used to derive the updated GMAPs is given in the publicly-posted document ""SUMAMPS-based Gain Maps for HRC-I", and will not be pressented in detail here.
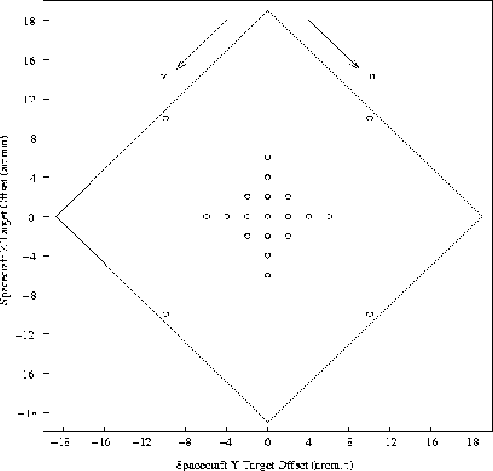
Fig. 13: Locations of the 21 pointings of AR Lac taken annually in September on HRC-I, to monitor
and update the gain map.
D. HRC-I PI BKGRND Spectrum 2016
A corresponding upgrade to the PIBGSPEC library for 2016 has also been derived, effective for the same time-period as the above HRC-I GMAP. The background PI spectra are generated from the same HRC-I calibration observations of AR Lac used to derive the new GMAP. These 21 observations are reprocessed with the new GMAP, generating new PI scaled to SUMAMPS values. The result is illustrated in Fig. 15 below, with the orange trace giving the new 2016 bacground spectrum, and previous years for comparison as given in the key.
For each year, the HRC-I Cal team extracts events in a 800x800 pixel box at the 17 observation locations that are within 10 arcmin of the aim point, excluding the location of the source. They sum the PI spectra from each location, weighting by exposure time, to create the final PI spectrum for the year. Finally, the PI spectra are Loess-smoothed with a third-degree polynomial fit over ranges 10 channels wide.

Fig. 15: PI background spectra from various dates in the CalDB. The new 2016 spectrum is
shown in the orange trace.


