Time History of the HRC Background
The HRC background is dominated by the effects of charged particles. In the
period from launch to the end of 2000, the overall background
rate in the HRC dropped. Since, then the rate has risen
slightly and possibly reached a plateau. This behavior is
correlated with the high-energy particle flux in which the Chandra
X-ray Observatory (CXO) is immersed, as measured by the
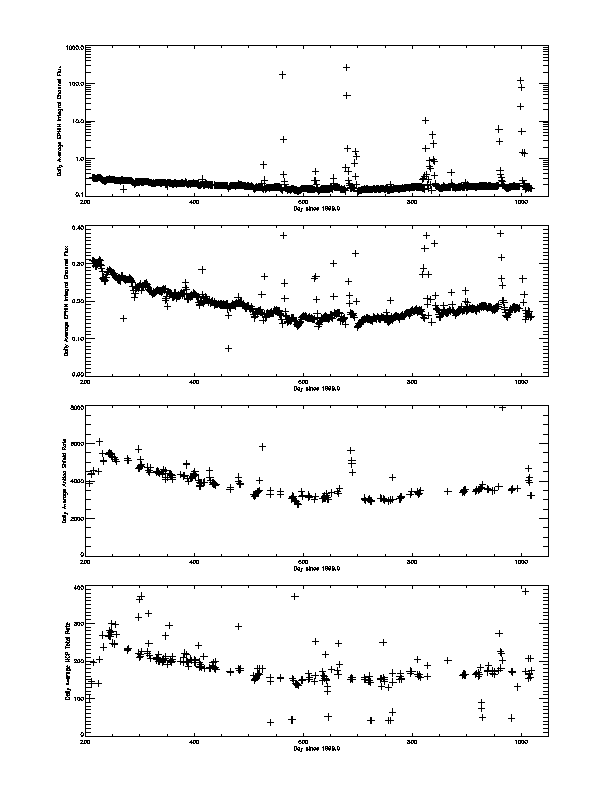
EPHIN. Figure 1 shows the time history of the EPHIN integral
channel flux along with the HRC anticoincidence detector rate and
MCP total event rate. Each point is a daily average. In order to
minimize the contribution from the earth's radiation belts to the
EPHIN data only times taken when the CXO was at a geocentric
distance greater than 80,000 km have been included. The HRC data
are taken from the "secondary science" rate data. The total event
rate measures all triggers of the MCP, including those from events
that are vetoed on-board. No separation has been made in the MCP
total rate data between times when the HRC-I or the HRC-S was selected
as the active detector. Except for the times when the HRC-S is operated
in imaging mode, the HRC-I and HRC-S active areas are roughly equal and
as a result we expect their total event rates will be roughly
equal.
 |
| Figure 1: EPHIN integral channel flux and HRC detector rates
as a function of time. All points are daily averages. The top
two panes show EPHIN data: in the first using a log range to
show the days with elevated rates due to solar activity, and in
the second using a linear range but scaled to show the bulk of
the data and the decreasing flux trend. The third pane is the
HRC anticoincidence detector rate. The bottom pane is the MCP
total event rate, both the HRC-I and HRC-S combined. Both the
HRC anticoincidence rate and MCP total event rate exhibit the
same decreasing trend as observed in the EPHIN data. |
The HRC and EPHIN data exhibit the same trend. The quality of the
correlations are better seen by directly plotting the HRC rate
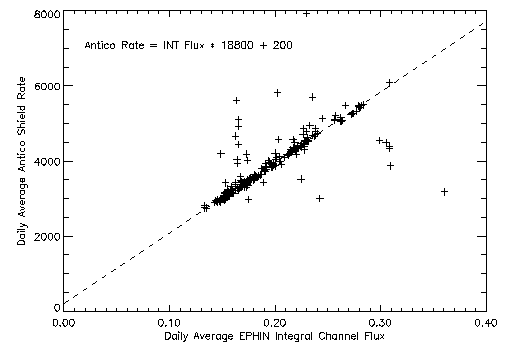
versus the EPHIN flux. Figure 2 is a scatter plot of the HRC
anticoincidence detector rate versus the EPHIN integral channel
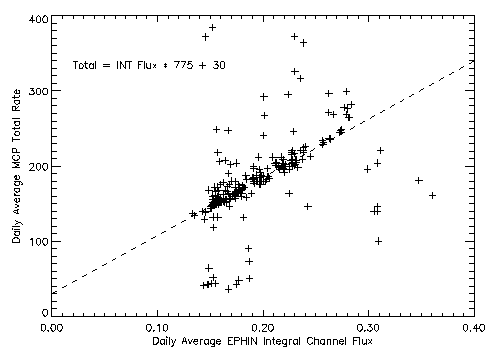
flux; figure 3 is similar but for the HRC MCP total event rate. The
HRC anticoincidence detector rate is rather well correlated with
the high-energy particle flux. The dashed line over-plotted in
figure 2 is from a fit to the scatter, clipped to eliminate the
effects of outliers.
 |
| Figure 2: Comparison of daily averages of HRC
anticoincidence detector rate to EPHIN integral channel
flux. |
The HRC MCP total event rate is less well correlated with the high-energy
particle flux. Some of this can be due to the contribution from
x-rays from observations of bright targets and some can be due
to the flaring background that appears to be attributable to
lower energy particles. The cluster of low total event rate
(30-60 count/s) points are from running the HRC-S in imagaing
mode, where only 1/3 of the dectetor area is active. The dashed
line in the scatter plot is a "fit-by-eye" correlation to the
higher density of points.
 |
| Figure 2: Comparison of daily averages of HRC MCP total
event rate to EPHIN integral channel flux. |
Mike Juda
Last modified: Mon Oct 29 11:21:14 EST 2001


