


|

|
| [Back to Agenda] |
An excellent LETG/ACIS-S target for LETG higher-order calibration is XTEJ1118+340 (April 18 2000, obsid 1701), a very bright X-ray nova, with lots of counts. Even so, there are various sources of error that must be understood when comparing higher orders vs 1st order:
Conclusions:
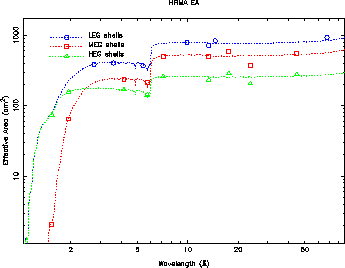
XRCF grating efficiency results were presented last year. Agreement with modeled 0th and 1st orders is good, but sampling of higher orders is much more sparse. Even with 0th and 1st, estimated errors (statistical plus generous systematic uncertainties--not shown) are usually smaller than measurement-model residuals, indicating that systematic errors are still not well understood. Diagreements between model and measurement for higher orders are thus risky to interpret, but results from the Mg-K measurements (which were relatively clean) suggest that higher order efficiencies may be slightly overestimated by current models.
 |  |
 |  |
Image of ACIS/LETG observation of XTEJ1118, nicely showing secondary diffraction, etc.

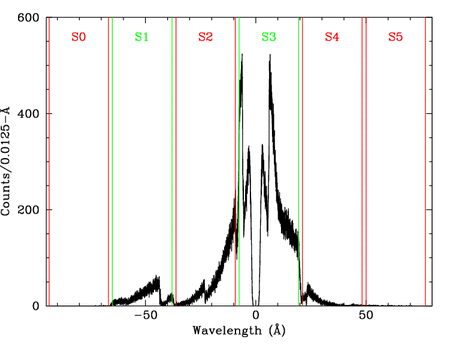
XTEJ1118 1st order spectrum, showing ACIS-S chips
XTEJ1118 1st, 2nd, 3rd order spectra (+ and - summed).
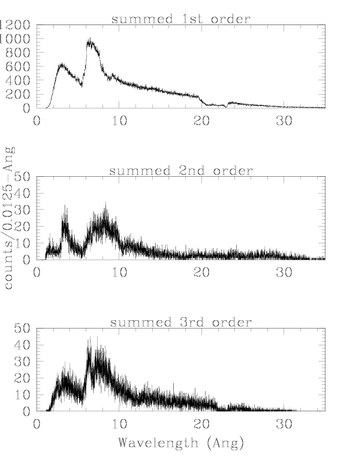
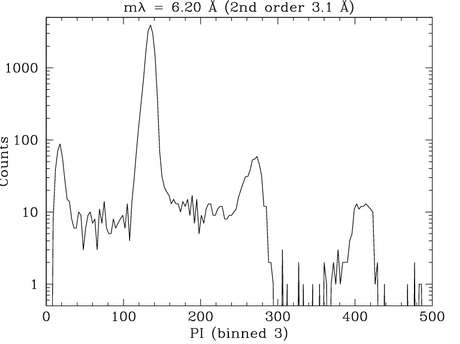
Illustration of 2nd-order pile-up at m*lambda=2*3.1 Ang. The near-0 peak is an escape peak (couple percent intensity), main (1st order 3.1-Ang) peak is at channel 135, and 2nd-order peak is at channel 270. 2nd-order peak is mostly from pileup (see in final plot that expected 2nd-order diffraction efficiency is extremely low). The "interpeak events" between the 1st and 2nd-order peaks also indicate pileup.
Pileup suppresses the apparent 1st-order intensity (by roughly 10% near 6 Ang) and enhances the apparent 2nd-order intensity (sometimes by orders of magnitude). This is discussed below.
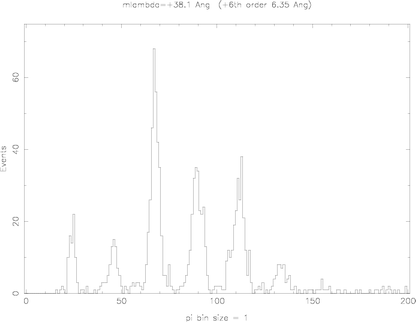
Example pulse-height spectrum--6th peak is 6th order of 6.35 Ang. Spectral fitting was not used, since different orders can be easily separated by eye. Errors introduced in this way are usually much smaller than statistical uncertainties.
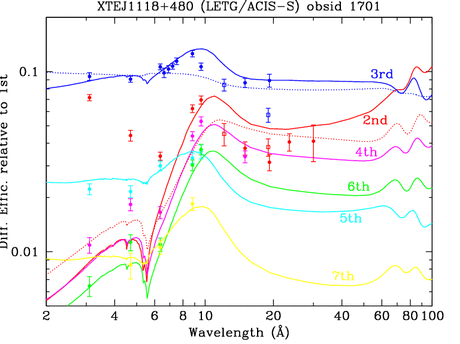
Preliminary results for XTEJ1118. Open circles are results from bright lines in a Capella spectrum. Dotted lines show the 3rd/1st and 2nd/1st curves for pre-launch model. Solid curves show current model predictions, with order-specific adjustments to analytical model based on PI ground calibration results from Panter facility.
The artificial enhancement of 2nd order from pileup is glaringly obvious below 6 Ang. As noted above, the number of 1st-order counts is slightly decreased by pileup, so the results plotted here should be considered as upper limits.
Things to note: 2nd and 3rd order efficiencies, relative to 1st order, seem to be overpredicted longwards of 6 Ang. The shape of the "bump" from roughly 6-12 Ang may also need adjustment. Further analysis of these and other data will provide better statistics, more complete wavelength coverage, and elimination/correction of pileup effects.
Last modified: 11/02/10
 |
The Chandra X-Ray
Center (CXC) is operated for NASA by the Smithsonian Astrophysical Observatory. 60 Garden Street, Cambridge, MA 02138 USA. Email: cxcweb@head.cfa.harvard.edu Smithsonian Institution, Copyright © 1998-2004. All rights reserved. |