

Soon after release of the new HRC-S gain calibration (Jun 2020, CALDB 4.9.2) it was discovered that the LETG/HRC-S background filter was sometimes removing more than the intended 1% of valid X-ray events. Excess losses were observed primarily at negative wavelengths for observations beginning c. 2017 and increasing over time (as gain decreased), with losses of up to 6% at some wavelengths by late 2020. Investigation revealed that the shape of event pulse height distributions (PHDs) was becoming subtly distorted at very low gains, with relatively large effects at the high-channel extremes of the PHDs, where the background filter takes effect.
Corrections have now been applied to the HRC-S TGAIN (time-dependent gain) coefficients so that the 99th percentile PI values for X-ray events, rather than the medians, are constant (or for certain subtaps, below the filter threshold; see details below). The background filter can now be safely applied for all observations (reprocessed using tbd files in CALDB tbd) prior to the HRC-S high voltage change on May 14 2021. For observations after that date, TGAIN coefficients are set to 1.0, so that SAMP values are converted to PI using the GAINMAP position-dependent corrections, but there are no time-dependence corrections (because the new time dependence cannot be adequately predicted yet). Therefore, background filtering cannot be applied for observations with the new high voltage setting, i.e., after May 14 2021. Below we discuss how the TGAIN coefficients were adjusted to yield PI values that work with the background filter.
In the main/2020 gain calibration, it was assumed that high percentile PI values scaled the same way as medians. This assumption was verified in previous gain calibrations, but was not thoroughly checked again until this work. In fact, at the very low gains of recent years, the high-channel tails of PHDs have grown stronger, so that the ratios of high percentiles vs median have increased by a few to several percent, pushing a larger fraction of valid X-ray events above the PI-based background filter.
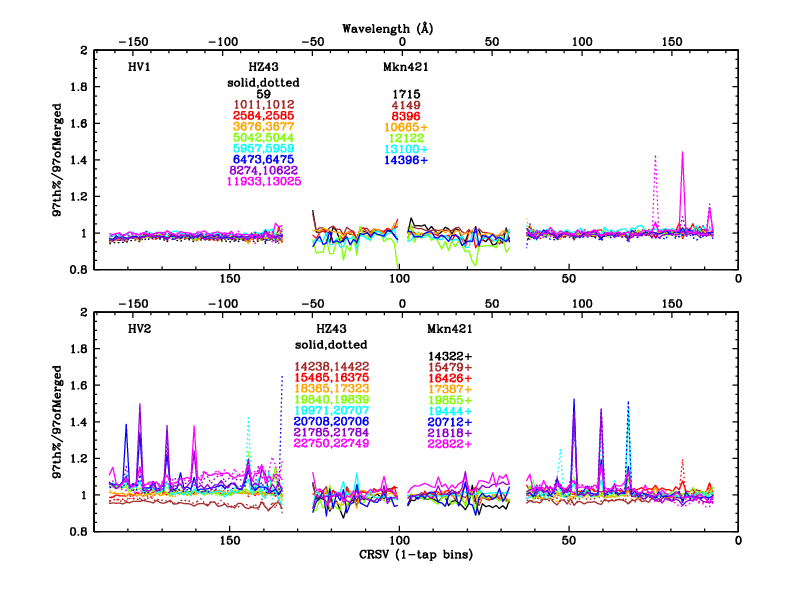
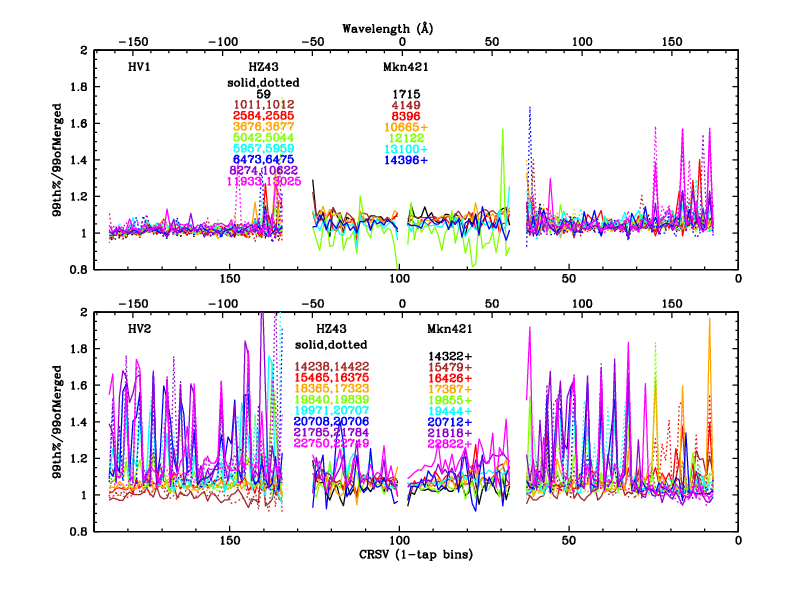
This effect is shown in Figure 1. If PI PHD shapes were invariant, the curves would all be flat with a value of 1. As can be seen, this was effectively true for many years, but deviations from the ideal have become significant in recent years. Mostly because of associated QE loss, the high voltage was raised in May 2021.
Two sorts of deviation are seen. The first is a general trend for
high-percentile curves to rise above 1, as the high-channel tails on
PHDs grow stronger as gain decreases.
The second feature is the increasing prevalence of "spikes" at
some locations, usually at roughly 8-tap intervals.
As shown in Figure 2, these spikes can occur on scales of less
than 1 tap.
 |
 |
 |
 |
| Fig. 1abcd: 95th, 97th, 98th, 99th percentile PI for HZ43|Mkn421 observations on outer|inner plates, normalized to the corresponding values for the merged data sets used to determine the 99th percentile for background filtering. To make trends easier to see, these plots use 1-tap binning. Numbers in the legends denote ObsIDs; those with "+" refer to groups of ObsIDs made at nearly the same time that were analyzed together. | |||
 |
| Fig. 2: [pdf] Same as 98th percentile plot in Fig. 1 but with 1/3-tap binning, as was used for identifying anomalous subtaps in each observation. |
The existence of spikes grows more pronounced at higher percentiles, and ideally the 99th percentile data would be used to adjust gain coefficients for proper background filtering, but it is difficult to differentiate PHD distortions from statistical fluctuations at that level on subtap scales, so we used the 98th percentile. "Bad" subtaps were tabulated for each ObsID using the following criteria:
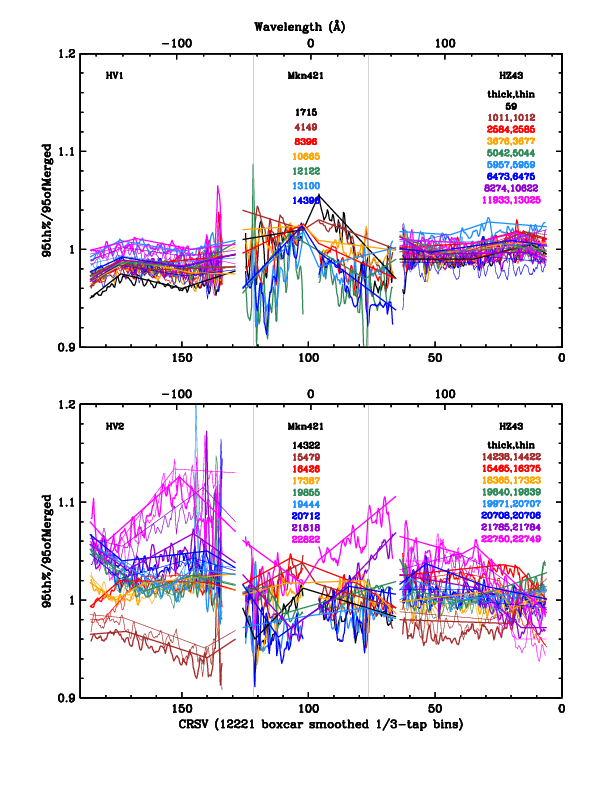
In the most recent observations, i.e., those with the worst anomalies, a total of 56 bad subtaps were identified on the outer plates, and 18 on the center plate. Bad subtaps were then excluded to better reveal general trends at high percentiles. Again, the 99th percentile was too noisy, and we used the 95th percentile because its results closely match those of the 97th and 98th and are less noisy. To reduce statistical noise and approximate the smoothing providing by Chandra's pointing dithering, data were averaged using a 5-subtap boxcar with 1:2:2:2:1 weighting. 3-piece linear "fits" were drawn by eye to trace the trends for each observation, erring on the high side so that PHDs tend to be pushed a little lower, i.e., below the filtering threshold. The data and fits are shown in Figure 3.
 |
 |
 |
| Fig. 3abc: [pdfs for left, middle, right panels]. (Left) Boxcar smoothed 95th percentile data, (middle) with fits, (right) and fits alone. For the last plot, calibration curves were raised by 0.8% for ObsID 20706 and lowered by 1.7% for ObsID 5957 based on assessments of these observations' deviations from gain trends. | ||
Fit results were then interpolated to match the CALDB TGAIN epochs, creating new gain coefficients for every CRSV subtap. Three TGAIN epochs in the HV1 era occur after the last HZ43 observation, and so gain coefficients on the outer plates were conservatively set 2, 4, and 6% larger than fitted extrapolations; for comparison, the gain changes by about 5% from one epoch to another.
In the HV2 era, TGAIN coefficients for epoch 16 (after the last observations of HZ43 and Mkn421) were conservatively set to those for epoch 15. Epochs 17 and 18 mark the beginning of the use of the new HRC-S HV setting (May 14 2021) and Jan 1 2040, respectively, and have their TGAIN coefficients set to 1.0. The GAINMAP spatial gain corrections will therefore be used to convert SAMP to PI, but there are currently no TGAIN corrections for the new HV setting and background filtering should not be used for any observations after May 14 2021.
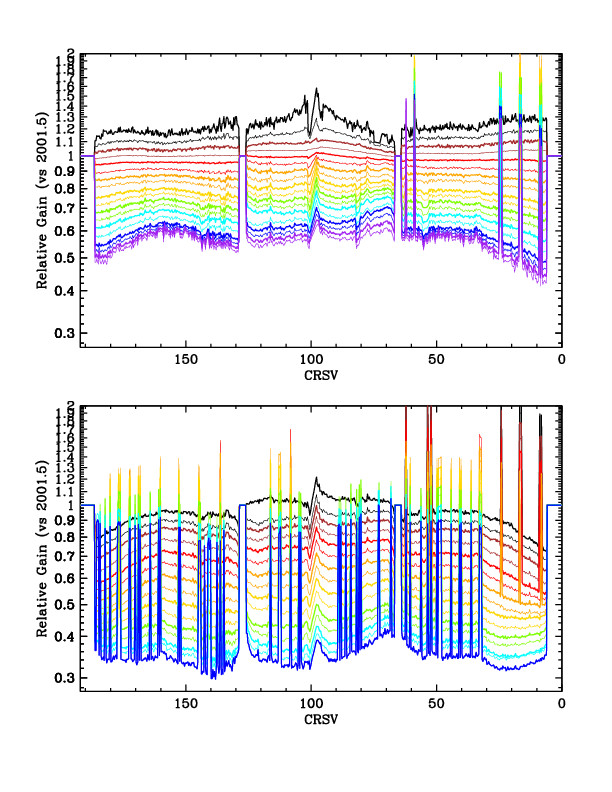
Once those adjustments to the gain coefficient were made, coefficients for the bad subtaps were scaled by a factor of 2.5 (note the excursions to 2.0 or higher in Fig. 2) so that the 99th percentiles of the PI PHDs will be below the filtering threshold. It was assumed that subtaps first became "bad" during the nearest TGAIN epoch that preceded the affected ObsID, or sometimes earlier (and conversely for the few subtaps early in the HV2 era that became "good" over time). The resulting gain coefficients are plotted in Figure 4.
 |
|
||
| Fig. 4: [pdf]. TGAIN coefficients for the HRC-S operating at HV1 (top, spanning 1999 Sep 4 to 2012 Jul 5) and HV2 (bottom, spanning 2012 Mar 18 to 2021 May 14). The two epochs for operation at HV3 (with coefficients set to 1) are not plotted. These TGAIN coefficients replace the ones derived in the main/2020 calibration, plotted here. | Fig. 5: Alternative visualization of the data in Figure 4, in terms of RAWY (instead of CRSV) and MJD time (instead of relative gain). Note that the sense of both axes is reversed between Figures 4 and 5. (Figure provided by D. Huenemoerder.) |
Typically, the 96th, 97th, 98th, and 99th percentile PI values lie
about 1.4, 3.3, 5.9, and 10.5% higher than the 95th percentile (c.f.
this figure, and note the ~7.2%
difference between the 97th and 99th percentiles, which is of relevance
below).
As can be inferred from Figure 3, systematic errors in calibrating
the channel of the 99th percentile PI PHD are very unlikely to
exceed 7% (in the "bad" direction) over a detector region covered
by dither (about 1.2 taps), and it thus very unlikely that the
background filter would ever remove more than 3% of valid X-ray events.