

|

|
Sun Mi Chung, Jeremy J. Drake, Vinay L. Kashyap, and the LETG team
August 2004
(This page describes the dispersion relation status as of Aug 2004. A wavelength correction tool, corrlam, based on extensions of the work described here was released early in 2005.)
The dispersion relation of the LETG+HRC-S is currently known to approximately a few parts in 10000, across the entire LETG+HRC-S wavelength range. With a dispersion of 1.148 Å/mm, the LETG+HRC-S covers a wavelength range of -165 to +175 Å. We have recently corrected the wavelength discontinuities observed between the central and outer HRC-S microchannel plates by effectively enlarging the plate gaps in the data processing software. This change has been implemented in the latest release of CIAO version 3.1. The dispersion relation for data processed with CIAO 3.1 shows an RMS of only 0.014 Å, across the entire LETG+HRC-S wavelength range.
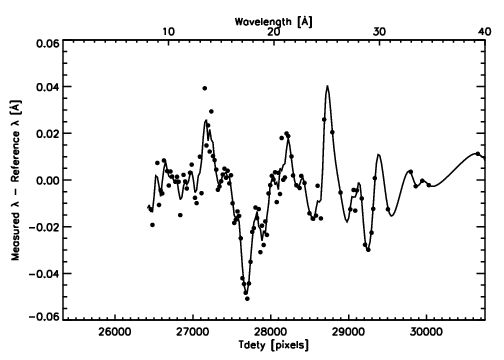
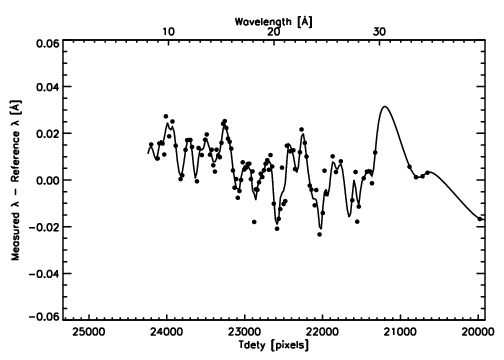
Although the wavelength discontinuities between the central and outer HRC-S plates have been corrected, there still remain non-linearities in the dispersion relation of up to ~0.05 Å. These non-linearities are due to non-linear imaging distortions of the HRC-S detector. We have derived and applied a preliminary wavelength correction as a function of detector location for data on the central HRC-S plate. The dispersion relation shows that the RMS decreases to 0.009 Å once the correction is applied. This is, however, work in progress, and test software is not yet available.
| Source | Obs ID | UT Start | Exposure [ks] | Offset [arcmin] |
|---|---|---|---|---|
| Capella | 1248 | 1999 Nov 9 13:27:21 | 85.23 | 0 |
| Capella | 2582 > | 2002 Oct 4 23:57:53 | 28.83 | -1.5 |
| Capella | 3479 | Oct 6 10:01:58 | 30.38 | +1.5 |

|
Note that the error-weighted mean (green dashed lines) for the central and positive order plates are significantly offset from zero. This is not a systematic wavelength offset which needs to be adjusted for the 2 plates, but rather an effect of the non-linearities of the dispersion relation. Although non-linearities are prominent, the RMS of the observed minus reference wavelengths is only 0.014 Å across all wavelengths. The RMS across the central plate data is even smaller at 0.012 Å.
tdety space, where
tdety is the detector coordinate in the dispersion
direction. For observations with normal mode pointing, the telescope
dithers in a lissajous pattern, spreading out the photons along the
detector, in both the dispersion and cross-dispersion directions. The
width of the dither pattern is nominally ~300 pixels, or 40
arcseconds. We can use this dither pattern to probe the dispersion
relation non-linearities across the detector.
Figure 2 shows the Fe XVII emission line
from standard processed Capella data (red)
plotted in λ versus tdety space.
By measuring the wavelength centroids of the events as a function of
tdety, we were able to obtain a wavelength correction
which could be applied to individual photon events based on their
tdety locations. Wavelength centroids were measured by
splitting up the data into a number of tdety bins, then
creating a wavelength histogram of the events in each bin, and fitting
a modified Lorentzian function to the histograms. We then subtract
the known laboratory or theoretical wavelength of the relevant line
from the measured
wavelength centroid of the data in each tdety bin, and obtain a
wavelength correction as a function of detector location.
Data shown in black in Figure 2 are photon events whose wavelengths
have been shifted based on measured line centroids of the original
data (red).
The corrected data now appear to follow a much
more horizontal line across the detector.
(For details see
SPIE paper by Chung et al., 2004.)

|
tdety, then measuring wavelength centroids, it is
essential that we have relatively unblended, high signal-to-noise
lines. Therefore, we can only obtain wavelength corrections for those
regions on the detector where high S/N lines fall. In October of
2002, two separate observations of Capella were obtained, each with
offset pointings of 1.5 arcminutes in opposite directions (ObsID 2582
and 3479).
These offset pointing observations were planned such that bright lines
would fall on
different parts of the detector, so that we could probe a greater
region of the detector for wavelength non-linearities. By using data
from on-axis Capella observations, combined with these off-axis
observations, we have derived a somewhat more complete
wavelength correction as a function of tdety. This
correction is shown in the Figure below.

|

|

|
The wavelength non-linearities that are currently observed in the data can
broaden out line profiles quite significantly.
Figure 5 is one of the most extreme examples of how much improvement
we can expect to see in line profiles, once a correction is applied to
flatten out the wavelength distortions. The post-correction data
(red) has a much sharper peak, and narrower line width. In this case,
the measured FWHM of the corrected data is approximately 25% smaller than the
original data.

|
Although we
have certainly made progress on characterizing the dispersion relation
non-linearities along the detector,
there still remain vast regions of the detector for which we do not
have sufficient data to map out the wavelength distortions. We are
expecting another observation of Capella, with an off-axis pointing of
+3.0 arcminutes. This will allow us to characterize
the wavelength non-linearities in regions of the detector that are
currently unknown.
Last modified: 11/18/11
 |
The Chandra X-Ray
Center (CXC) is operated for NASA by the Smithsonian Astrophysical Observatory. 60 Garden Street, Cambridge, MA 02138 USA. Email: cxcweb@head.cfa.harvard.edu Smithsonian Institution, Copyright © 1998-2004. All rights reserved. |