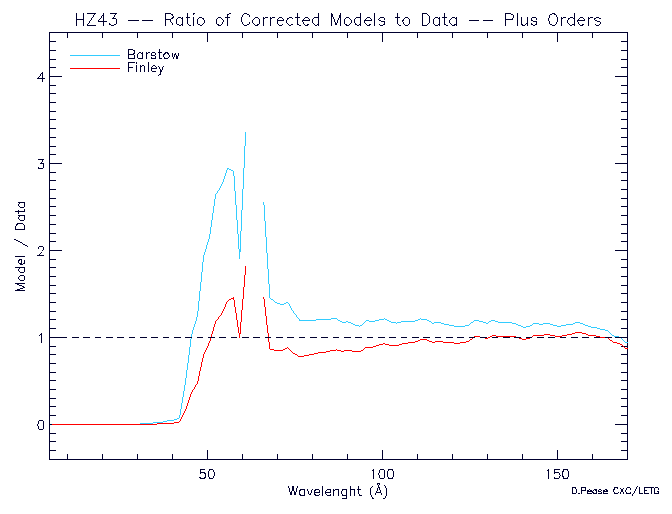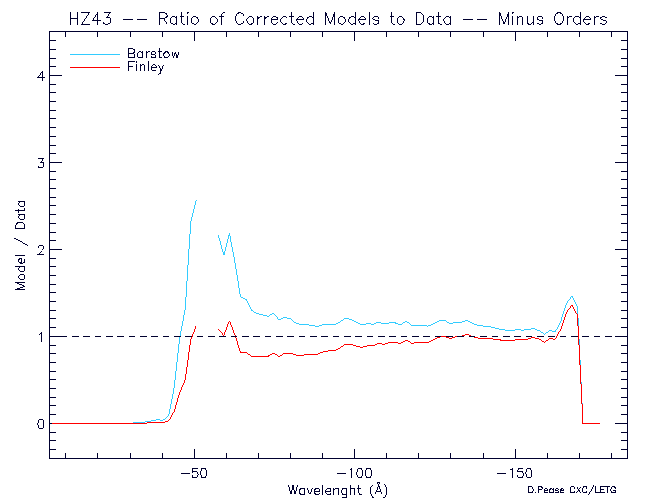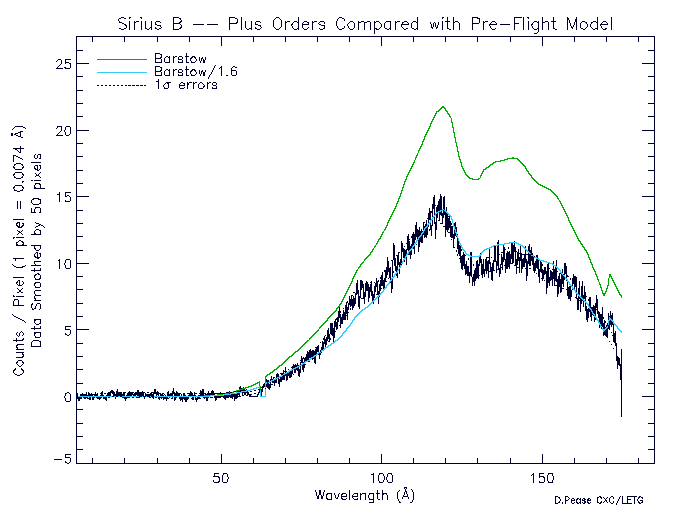
We've completed a preliminary on-orbit calibration of the HRC-S low energy QE, using Sirius B spectra (ObsIDs 1421, 1452, 1459 co-added). Employing the Sirius B emission model for which we have the most confidence (acquired from Martin Barstow, Leicester University) we derive a correction to the Chandra LETGS Effective Area for wavelengths longward of 44 Angstroms (ie. Energies below C-Ka @ 0.277keV). Though we make the correction in terms of the effective area, the fundamental correction is to the Model of the HRC-S Quantum Efficiency (the HRMA, HRC-S UV/Ion Shields, and LETG efficiency are well-calibrated). The corrections are intrinsically linked to the dispersion of the LETG. (ie. specific wavelengths/energies correspond to specific locations on the HRC-S.)
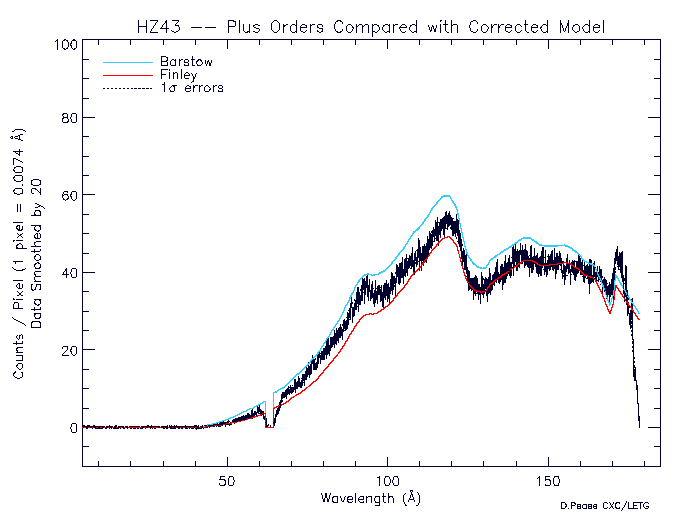
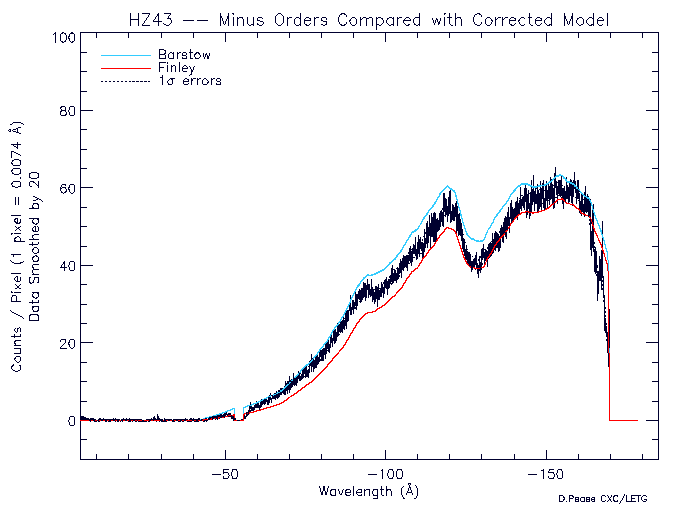
The plots below highlight the method we use to correct the Chandra LETGS Effective Area. At the bottom of the page, we show a comparison with HZ 43, employing models provided by Martin Barstow and David Finley (Eureka Scientific).
Another key component to deriving the HRC-S QE is the efficiency of the spectral extraction, which is dependent on a defined detector region. Highlights of this process can be found on the LETG Extraction Region Efficiency page.
This analysis is ongoing.
A comparison of the pre-flight implemented "Flight" Model Effective Area with the Sirius B data indicated that the model over estimated the Low Energy response by an average factor of about 1.6.

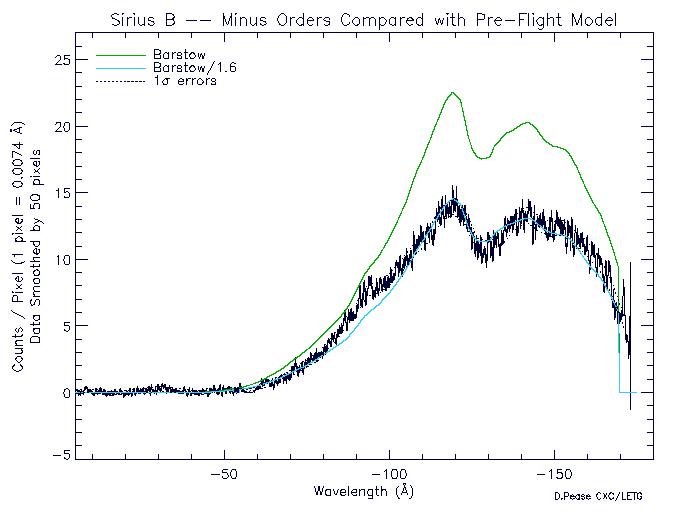
These correction curves are derived from the simple ratio of the Model-Predicted to the Observed Counts. There are separate corrections for Plus and Minus Orders, and they are valid for wavelengths greater than 44 Angstroms. We divide the Pre-Flight model by the correction factor to get the new Model.
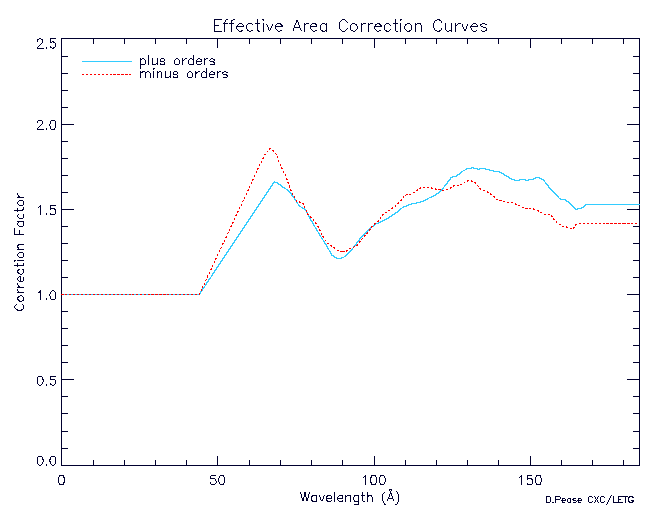
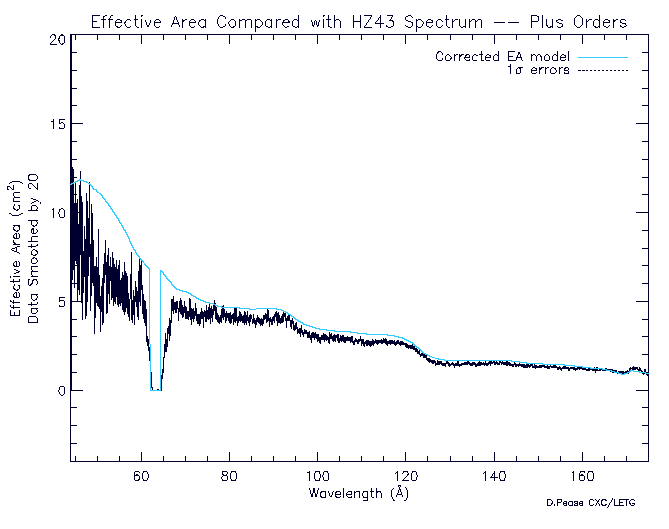
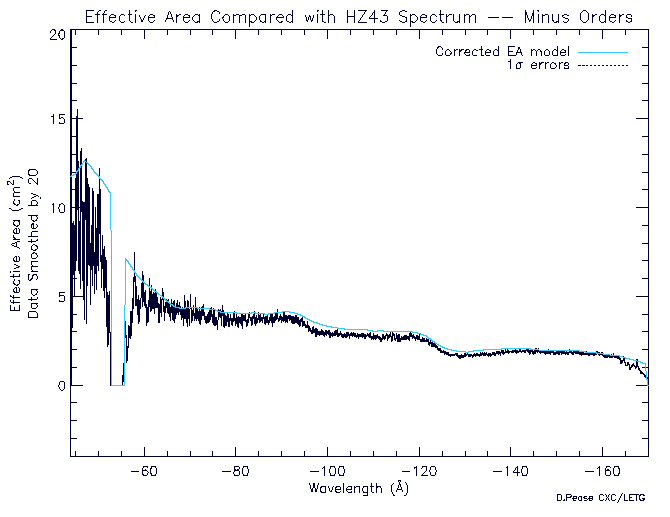
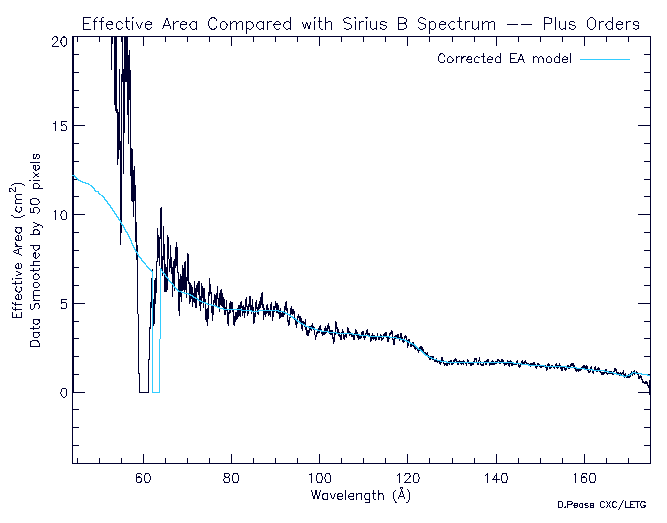
Here we show plots of the corrected effective area and the results of comparison with the Sirius B observations (a perfect "fit", of course).
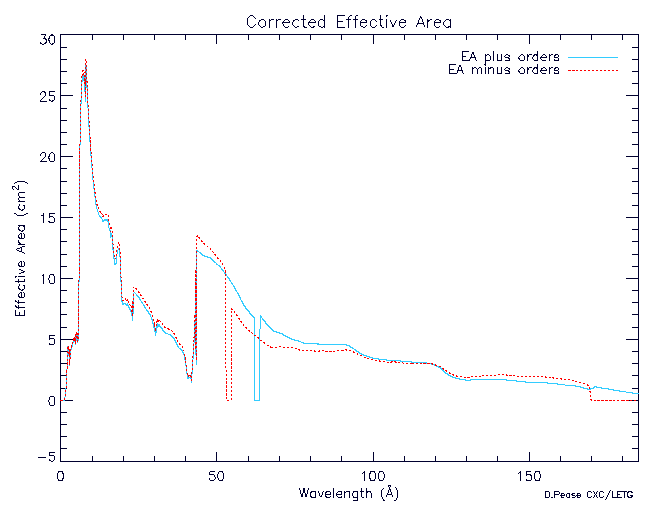
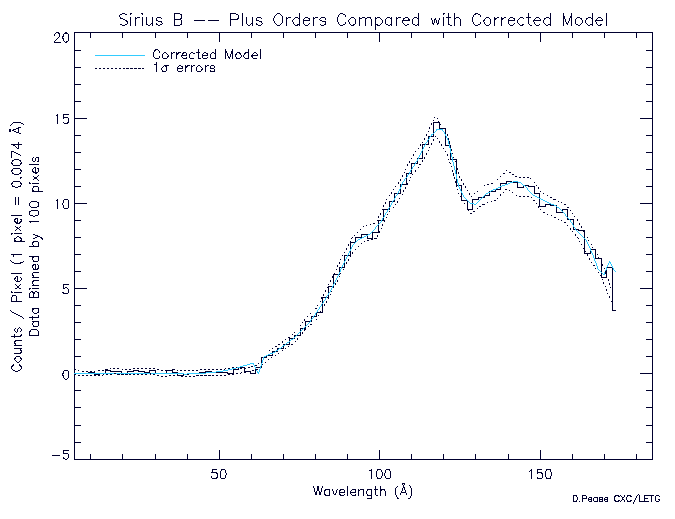
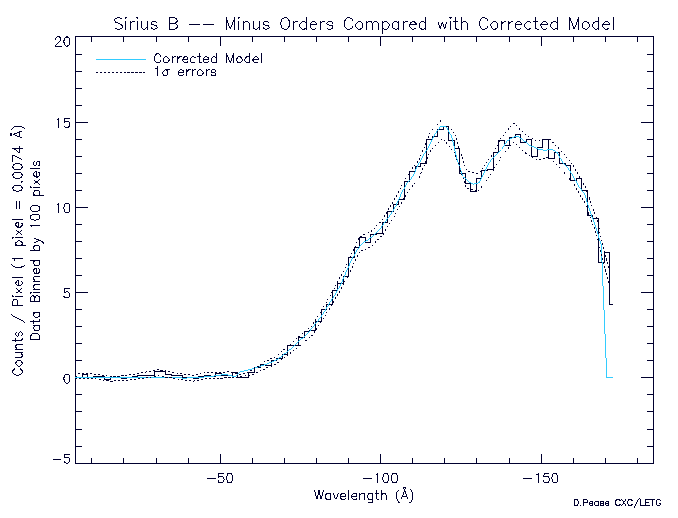
The observed HRC-S michrochannel plate gaps are slightly offset from the model because the Sirius B data was acquired with a displacement from the nominal aimpoint.

These plots show the new effective area model compared with the HZ 43 observation. Since HZ 43 played no part in the derivation of the correction, this comparison represents an independent check of the new model QE. The variations in "fit" seen stem from variations/uncertainties in the emission models of HZ 43.
