Chandra/HRC-I Quantum Efficiency vN0011
Vinay Kashyap & Pete Ratzlaff
NOTE: These QE products have been updated to Version 12 as of 2020 June.
We have constructed a series of QE files for the HRC-I, designed to account for the drop in QE observed at low energies with monitoring observations of white dwarf HZ 43.
The shape of the QE at E<626 eV is set identical to that of the HRC-S, and the values are adjusted such that the predicted counts match the observed counts.
A separate QE file is made for each epoch corresponding to when the HZ 43 calibration observations were made.
The basic structure of the HRC-I QE was set with v2.1, when the same QE as the HRC-S was essentially pasted on at energies E<626 eV.
Small corrections were applied in v2.2, and adjustments were made through v8 to account for changes in the HRC-S QE calibration.
A correction was made in v9 to account for a change in how the extraction efficiency was included, and a further correction to bring the high- and low-energy parts in sync in v10.
Several factors now indicate that substantial changes must be made to the HRC-I QE.
The first is that the HRC-S QE has been made into a time-dependent product, with the result that there is an artificial divergence between the HRC-S and HRC-I at low energies.
But crucially, the monitoring of the soft source HZ 43 with the HRC-I shows that it has been steadily decreasing in its count rate since c.2011, keeping pace with HRC-S measurements.
Table 1 lists all the LETGS+HRC-I observations of HZ 43, and Figure 1 shows how the 0th-order count rate has changed with time.
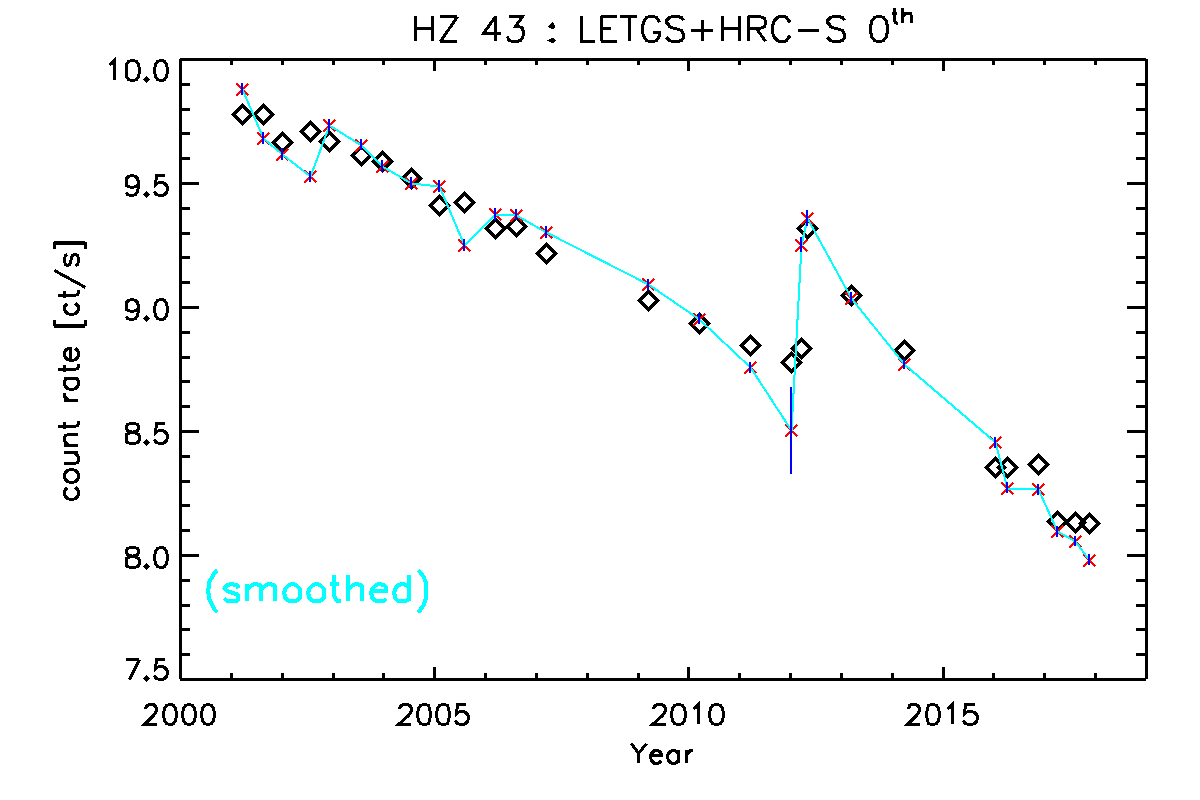
For comparison, Table 2 lists LETGS+HRC-S observations spanning the same time range, and Figure 2 shows the evolution of the 0th-order count rate.
Table 1: Aimpoint observations of HZ 43 with LETGS+HRC-I
| ObsID | Observation Date | Exposure [s] | Net Rate (within 30 pix) |
|---|
| 01514 | 2000-02-03T09:38:00 | 2148.53943643 | 3.94795 +- 0.0428679
|
| 01515 | 2000-02-03T18:10:05 | 5387.99776024 | 3.53429 +- 0.0256132
|
| 01000 | 2001-01-12T09:53:12 | 3877.62888196 | 3.84319 +- 0.0314837
|
| 01001 | 2001-07-25T12:35:30 | 4940.50874739 | 3.90693 +- 0.0281231
|
| 02600 | 2002-01-02T01:22:55 | 1884.62742402 | 3.86333 +- 0.0452794
|
| 02602 | 2002-07-23T19:58:54 | 1879.79200357 | 3.83031 +- 0.0451458
|
| 03714 | 2003-01-24T03:23:17 | 1860.07744120 | 3.88477 +- 0.0457034
|
| 03715 | 2003-07-24T09:12:43 | 1885.50047382 | 3.85066 +- 0.0451931
|
| 05043 | 2003-12-20T12:05:02 | 1970.78958435 | 3.9229 +- 0.0446176
|
| 05045 | 2004-07-19T16:17:33 | 2133.32071688 | 3.85259 +- 0.0424992
|
| 05958 | 2005-02-20T20:57:26 | 2164.91783402 | 3.89939 +- 0.0424431
|
| 05960 | 2005-08-08T08:04:20 | 1758.80684184 | 3.88425 +- 0.0470025
|
| 06474 | 2006-01-25T13:18:21 | 2145.33795822 | 3.93689 +- 0.0428406
|
| 06476 | 2006-07-24T21:35:00 | 2169.00029108 | 3.82654 +- 0.0420055
|
| 08275 | 2007-03-19T12:10:41 | 2156.45758149 | 3.84343 +- 0.0422218
|
| 09619 | 2008-03-14T06:00:42 | 2162.00535425 | 3.8474 +- 0.0421896
|
| 10623 | 2009-03-11T13:01:57 | 2160.85369138 | 3.85043 +- 0.0422172
|
| 11934 | 2010-03-20T23:31:59 | 2157.93674384 | 3.81965 +- 0.0420783
|
| 13046 | 2011-03-15T10:54:05 | 2121.90127156 | 3.83889 +- 0.0425404
|
| 14255 | 2012-04-14T17:12:40 | 2156.22300267 | 3.71956 +- 0.0415383
|
| 15394 | 2013-03-14T13:07:44 | 1790.26338380 | 3.69481 +- 0.0454341
|
| 16374 | 2014-04-25T17:40:56 | 2129.96886316 | 3.64093 +- 0.0413499
|
| 17378 | 2015-03-09T12:04:56 | 2165.26647911 | 3.69664 +- 0.0413235
|
| 18414 | 2016-01-05T19:23:02 | 2165.08648634 | 3.58166 +- 0.0406792
|
| 19846 | 2016-11-19T11:26:52 | 2155.80819175 | 3.47995 +- 0.0401853
|
| 19847 | 2017-05-20T22:14:26 | 2064.74236737 | 3.3562 +- 0.0403271
|
| 19970 | 2017-11-15T12:53:56 | 2157.00135042 | 3.33657 +- 0.0393385
|
Figure 1: Measured 0th order count rates of HZ 43 observed with the LETGS+HRC-I. The background subtracted net rates divided by 0.9 to account for the enclosed energy fraction (red `x's) and 1-sigma error bars (blue vertical lines) are shown, along with a Loess-smoothed curve (cyan) that represents the overall trend. Count rates predicted using HRC-I QE v10 are shown as open diamonds, and show an increasingly large deviation since 2011. The offset seen even at early epochs is attributable partly to the gridding of the effective areas (see below), partly to changes in the HRC-S effective area, and partly to changes in the assumed HZ 43 model spectrum. |
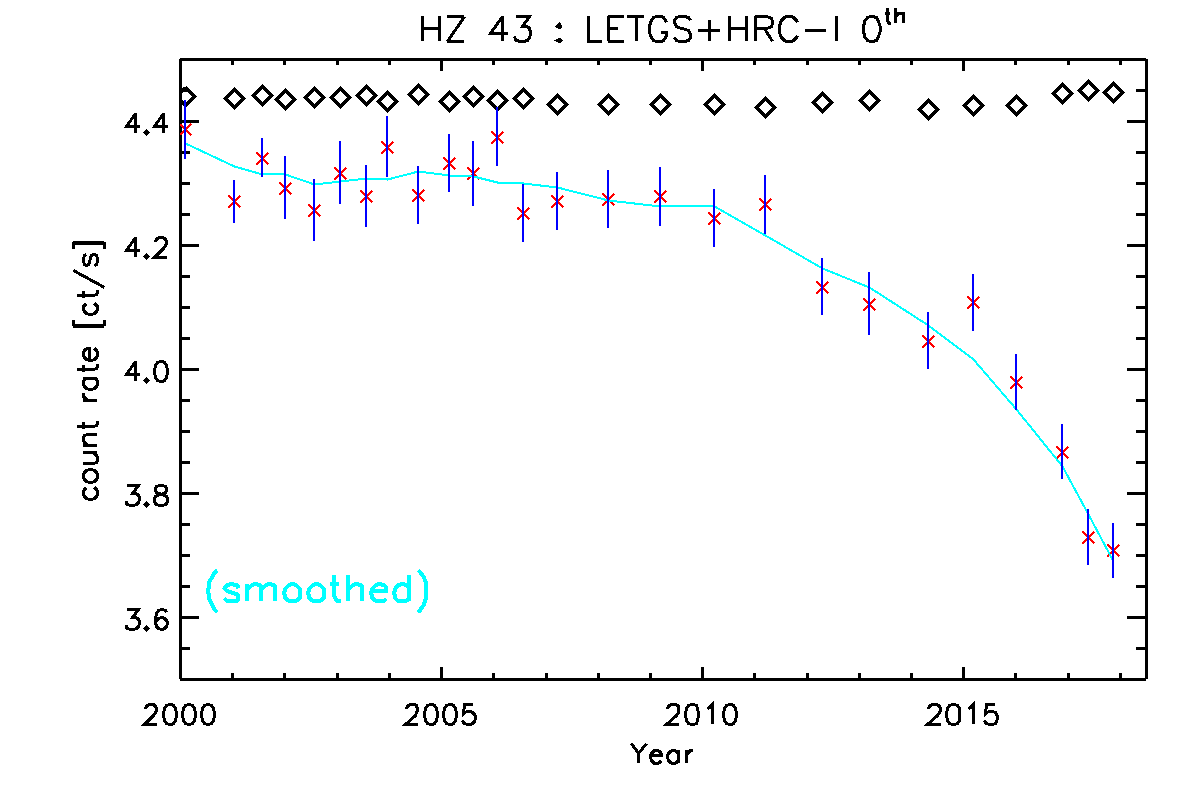 |
Table 2: Aimpoint observations of HZ 43 with LETGS+HRC-S
| ObsID | Observation Date | Exposure [s] | Net Rate (within 30 pix) |
|---|
| 01011 | 2001-03-18T21:50:28 | 18600.42067388 | 8.89045 +- 0.0218643
|
| 01012 | 2001-08-18T13:57:23 | 19941.05241289 | 8.71287 +- 0.0209054
|
| 02584 | 2002-01-01T19:51:46 | 19008.92004802 | 8.65551 +- 0.0213409
|
| 02585 | 2002-07-23T14:01:38 | 19989.37279413 | 8.57395 +- 0.0207127
|
| 03676 | 2002-12-04T23:24:07 | 19804.66300125 | 8.75943 +- 0.0210326
|
| 03677 | 2003-07-24T03:24:43 | 20009.29670729 | 8.68882 +- 0.0208401
|
| 05042 | 2003-12-20T15:02:58 | 19686.04984217 | 8.61144 +- 0.0209169
|
| 05044 | 2004-07-19T17:11:43 | 19665.05153283 | 8.55058 +- 0.0208544
|
| 05957 | 2005-02-02T07:35:34 | 19990.64037013 | 8.53933 +- 0.0206702
|
| 05959 | 2005-07-29T12:39:07 | 17646.06784164 | 8.32646 +- 0.0217257
|
| 06473 | 2006-03-13T22:55:47 | 19958.51991271 | 8.437 +- 0.0205631
|
| 06475 | 2006-08-07T11:56:40 | 19685.86403728 | 8.43556 +- 0.020704
|
| 08274 | 2007-03-14T16:15:38 | 19950.65429798 | 8.37237 +- 0.0204884
|
| 10622 | 2009-03-18T06:17:02 | 19884.09251628 | 8.18183 +- 0.0202885
|
| 11933 | 2010-03-15T13:04:06 | 19919.84833233 | 8.05752 +- 0.0201155
|
| 13025 | 2011-03-16T02:34:32 | 19918.59937256 | 7.88107 +- 0.0198943
|
| 14370 | 2012-01-09T12:58:01 | 310.28462105 | 7.6523 +- 0.157063
|
| 14238 | 2012-03-18T05:17:06 | 10049.15314771 | 8.32667 +- 0.0287872
|
| 14422 | 2012-04-28T00:32:47 | 10082.41039824 | 8.42213 +- 0.028906
|
| 15465 | 2013-03-14T20:14:11 | 19976.73741556 | 8.13303 +- 0.02018
|
| 16375 | 2014-03-30T16:29:06 | 19965.12884541 | 7.8931 +- 0.0198857
|
| 18365 | 2016-01-07T22:45:41 | 19950.46432932 | 7.60951 +- 0.0195332
|
| 17323 | 2016-04-09T19:16:41 | 19974.19346349 | 7.44399 +- 0.0193083
|
| 19840 | 2016-11-16T17:59:23 | 19930.06328760 | 7.43838 +- 0.0193229
|
| 19838 | 2017-04-04T00:16:44 | 19938.80172242 | 7.286 +- 0.0191199
|
| 19839 | 2017-08-08T06:00:48 | 19949.84639196 | 7.25117 +- 0.0190689
|
| 19971 | 2017-11-16T11:29:53 | 18098.39938727 | 7.18345 +- 0.0199276
|
Figure 2: As Figure 1, for measured 0th order count rates of HZ 43, corrected for the PSF fraction, observed with the LETGS+HRC-S. Count rates predicted using the HRC-S QEU v8 and QEv14 are shown as open diamonds. The predicted rate at the cusp of the high voltage change carried out in early 2012 is incorrect because correct analysis requires manually setting the appropriate QE and QEU files, which we deemed unnecessary for the purposes of this exercise. |
 |
For each HZ 43 ObsID, the level 1 event list and associated files were downloaded from the archive and reprocessed using the CIAO tool chandra_repro.
The locations of the 0th order was manually determined by centroiding using ds9.
Source counts were collected within a radius of 30 pix, corresponding to 90% enclosed counts fractions (see Appendix B), and background counts were collected from four rectangular regions placed to avoid the dispersion axis and the LETG support structure diffraction pattern.
The resulting net count rates are reported in Table 1 for HRC-I and Table 2 for HRC-S.
0th-order effective areas were constructed for each observation using the CIAO tool specextract and expected count rates were computed by multiplying the HZ 43 spectrum.
Note that by default specextract picks up an energy grid from the aimpoint RMF, for which the grid is very coarse over the energy range where HZ 43 emits.
This coarseness can lead to a significant numerical error in the predicted rates (see Figure 1), and it is crucial that a fine energy grid be applied.
Using grids that use constant width in keV is insufficient since the HZ 43 spectrum has a very soft spectrum.
specextract was updated on 2018-May-11 to allow the use of energy grids extracted from arbitrary RMFs, and we use the same energy grid as in the LETG RMF, since it is regularly gridded in wavelength.
Our goal is to apply the shape of the HRC-S QE to the low-energy end (E<626 eV) of the HRC-I QE.
Note that the two detectors have different filter thicknesses, and the QE files in the CalDB include these corrections.
Thus, we first divide the HRC-I QE by the corresponding filter transmission to recover the bare HRC-I QE.
For the HRC-S, the time dependence of the effective area is in the QEU, and hence we first compute the product of the HRC-S QE and the HRC-S QEU for the epoch corresponding to the HRC-S observation, then divide out the UVIS filter transmission corresponding to the central part of S1 overlapped by the thick filter.
We compute a correction factor to the HRC-S QE at each epoch of an HRC-I observation as the product of
HRC-S QE rescale = (flux-weighted HRC-S QE) *
(predicted rate in HRC-I/predicted rate in HRC-S) *
(1/flux-weighted HRC-I QE) *
(smoothed observed rate in HRC-I/predicted rate in HRC-I) *
non-linearity factor
where the HRC-S quantitities are computed at the corresponding HRC-S observation epochs and then interpolated to the HRC-I epochs.
At first pass, the non-linearity factor (which arises due to the complex shapes of the spectrum and the QE) is set to 1, and an intermediate HRC-I QE is constructed.
The product of the HRC-S QE and QEU is multiplied by the rescaling factor and pasted on to the HRC-I.
To ensure a smooth transition in the HRC-I QE, we construct a linearly interpolated weight over a wavelength range of ±0.1Å spanning E=626 eV.
The intermediate QE is then multiplied with the UVIS filter transmission, and an updated predicted rate is computed.
The non-linearity factor is then estimated as the average of the ratio of the smoothed observed rate to the predicted rate, and is approximately 0.963.
This value is then used to reconstruct a new HRC-I QE using the same steps as above, and the UVIS filter transmission is multiplied back in, and the new QEs are written out as FITS files with timestamped names describing when they are applicable.
The new QEs are available in CalDB v4.7.9 at $CALDB/data/chandra/hrc/qe/ --
- hrciD1999-07-29qeN0011.fits
- hrciD2000-07-23qeN0011.fits
- hrciD2001-04-19qeN0011.fits
- hrciD2001-10-16qeN0011.fits
- hrciD2002-04-14qeN0011.fits
- hrciD2002-10-25qeN0011.fits
- hrciD2003-04-25qeN0011.fits
- hrciD2003-10-06qeN0011.fits
- hrciD2004-04-05qeN0011.fits
- hrciD2004-11-05qeN0011.fits
- hrciD2005-05-15qeN0011.fits
- hrciD2005-11-01qeN0011.fits
- hrciD2006-04-25qeN0011.fits
- hrciD2006-11-21qeN0011.fits
- hrciD2007-09-16qeN0011.fits
- hrciD2008-09-11qeN0011.fits
- hrciD2009-09-15qeN0011.fits
- hrciD2010-09-16qeN0011.fits
- hrciD2011-09-29qeN0011.fits
- hrciD2012-09-29qeN0011.fits
- hrciD2013-10-05qeN0011.fits
- hrciD2014-10-03qeN0011.fits
- hrciD2015-08-09qeN0011.fits
- hrciD2016-06-15qeN0011.fits
- hrciD2017-02-20qeN0011.fits
- hrciD2017-08-20qeN0011.fits
Validation
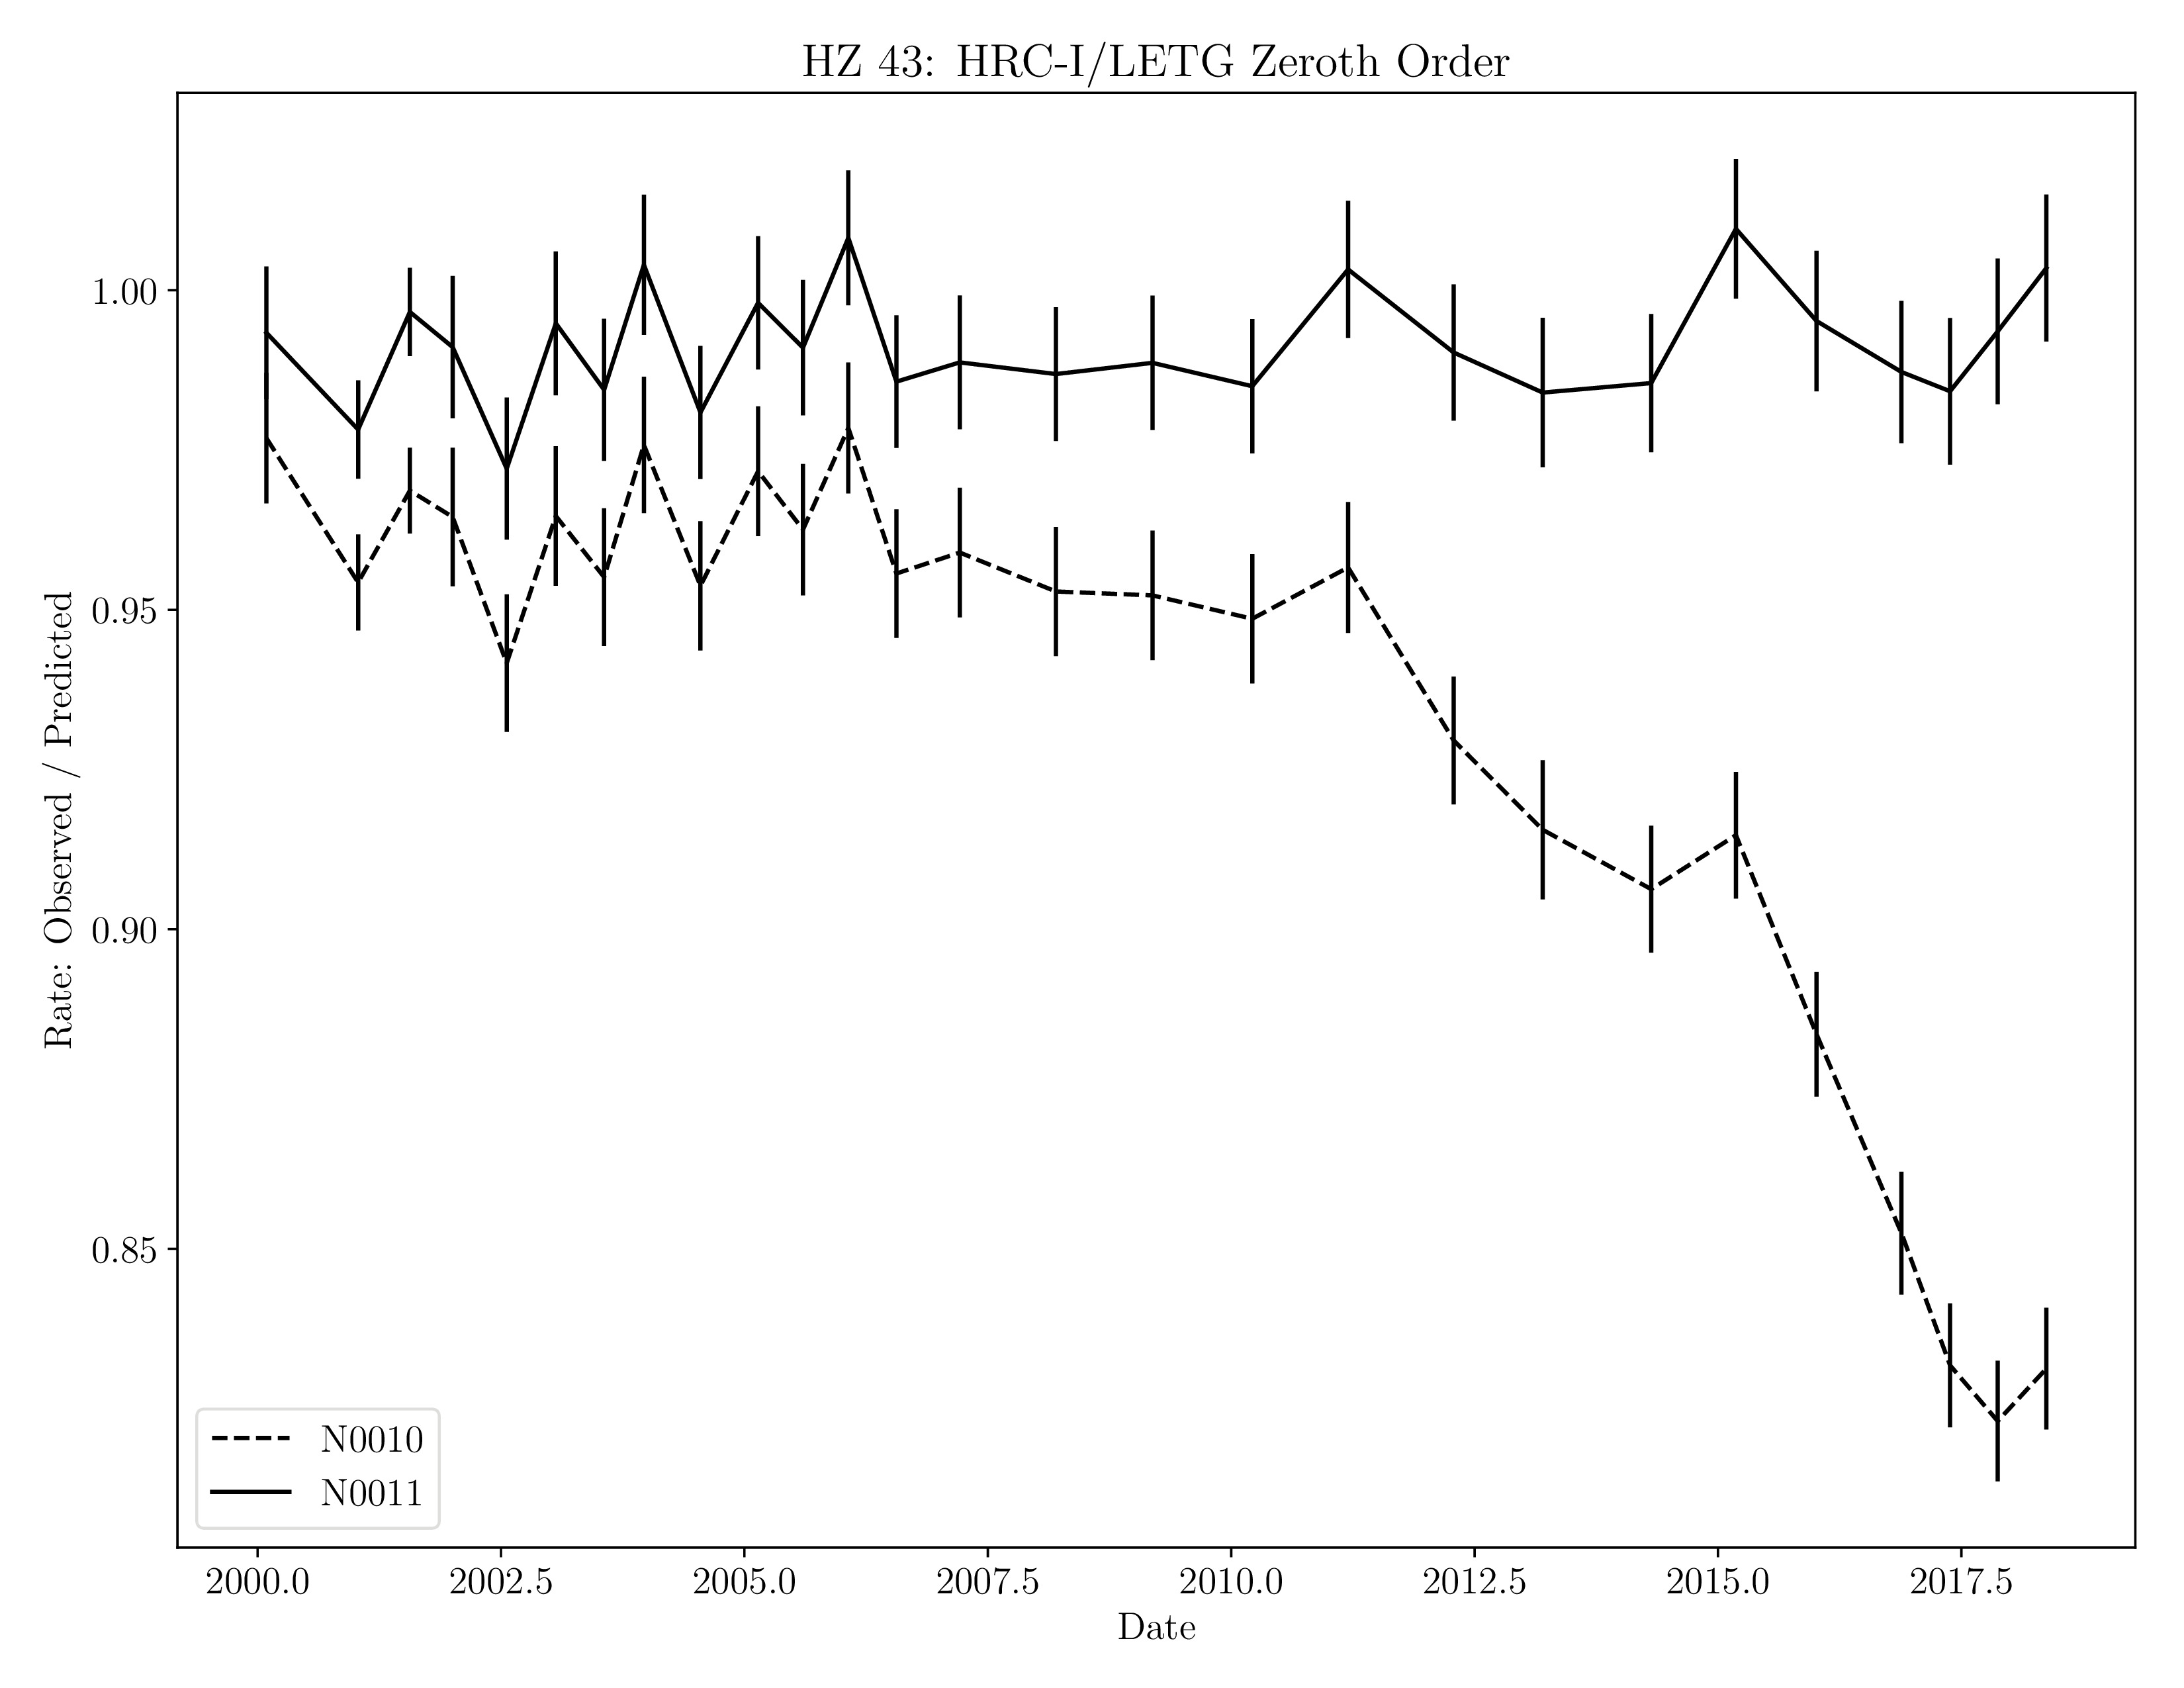
After the new QE files were constructed, we carried out an end-to-end recalculation of the effective areas, computed the predicted rates, and compared them with net rates obtained over circular regions of radii 100 pix.
The results are shown in Figure 3, and demonstrate that the corrections to the QE result in accurate predictions of the rates at low energies.
Figure 3: Comparison of the observed and predicted count rates in the 0th-order of the LETGS+HRC-I observations of the soft source HZ 43. The ratios of the observed to predicted rates are shown for the previous version of the QE (vN0010 -- dashed line) and the new one (vN0011 -- solid line). The vertical bars denote statistical 1-sigma errors. |
 |
- Calibration Resources on Quantum Efficiency of the Microchannel Plates
- cxc.harvard.edu/cal/Hrc/detailed_info.html#mcp_qe
- HRC-I QE v2.1
- Hole, K.T., Donnelly, R.H., & Brown, J.P., 2002, CXC Memo, A New Flight Model of the HRC-I MCP Quantum Efficiency
- cxc.harvard.edu/cal/Hrc/Documents/mcp_qe_i.v2.1.pdf [.pdf]
- HRC-I QE v2.2
- Posson-Brown, J., Donnelly, R.H., & Pease, D., 2003, CXC Memo, An Update to the HRC-I Quantum Efficiency Model
- cxc.harvard.edu/cal/Hrc/Documents/mcp_qe_i.v2.2.pdf [.pdf]
- HRC-I QE vN0008
- Posson-Brown, J. & Kashyap, V., 2010, CXC Memo, An Update to the HRC-I MCP QE Model
- cxc.harvard.edu/cal/Hrc/QE/hrci_qe_N0008.html [.html]
- HRC-I QE vN0009
- Wargelin, B. & Ratzlaff, P., 2015, CXC Engineering Change Request, HRC-I QE Upgrade
- icxc.harvard.edu/calco/ard_updates/ECR/Approved_ECRs/CXC_2015_010.pdf [internal/.pdf]
- HRC-I QE vN0010
- Ratzlaff, P. & Kashyap, V. 2016, CXC Engineering Change Request, HRC-I QE N0010
- icxc.harvard.edu/calco/ard_updates/ECR/Approved_ECRs/CXC_2017_003.pdf [internal/.pdf]
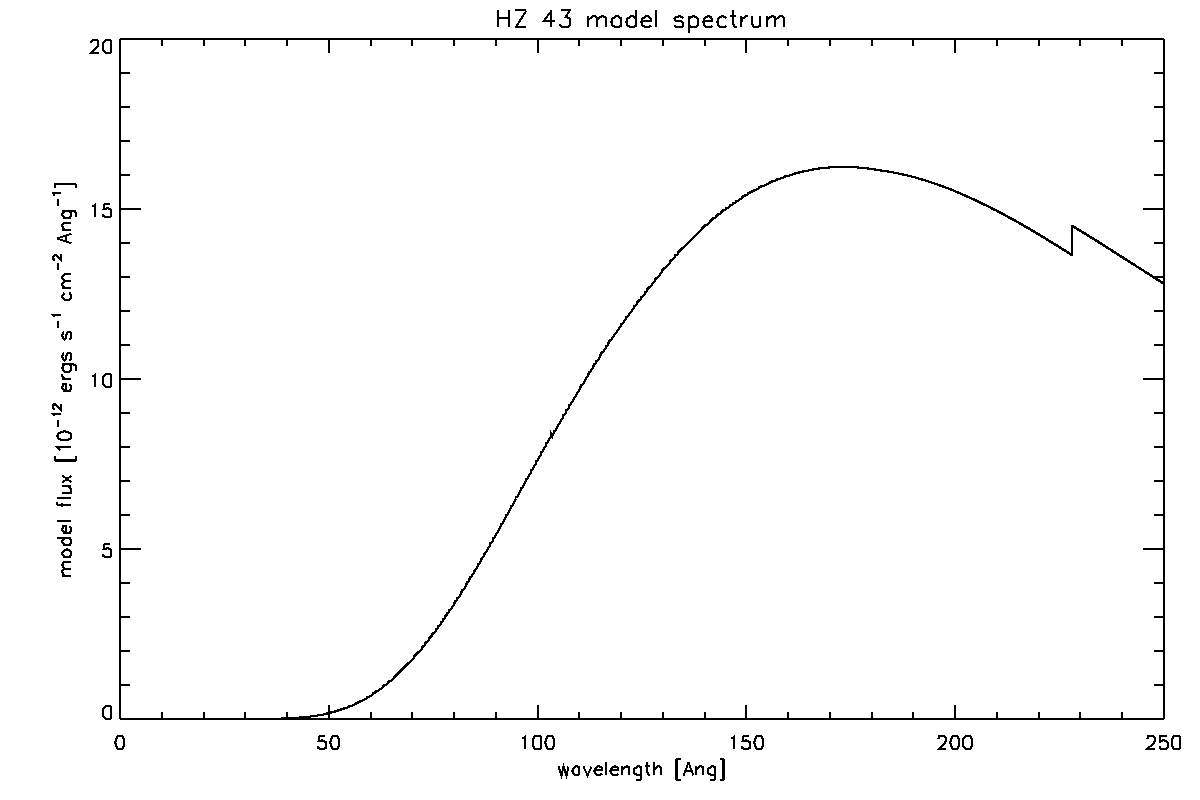
We use a model for the spectrum of the white dwarf obtained via Jeremy Drake.
The spectrum is shown in Figure A.1 below.
Fig B.1: Excluding background events from analysis
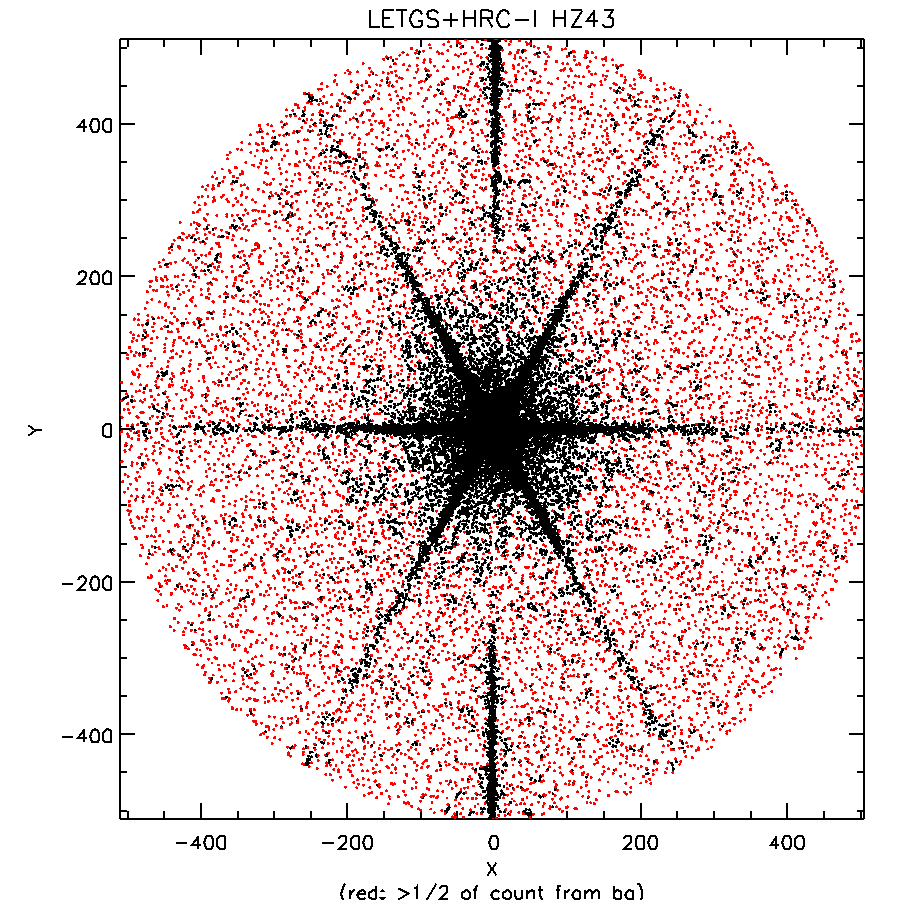 | 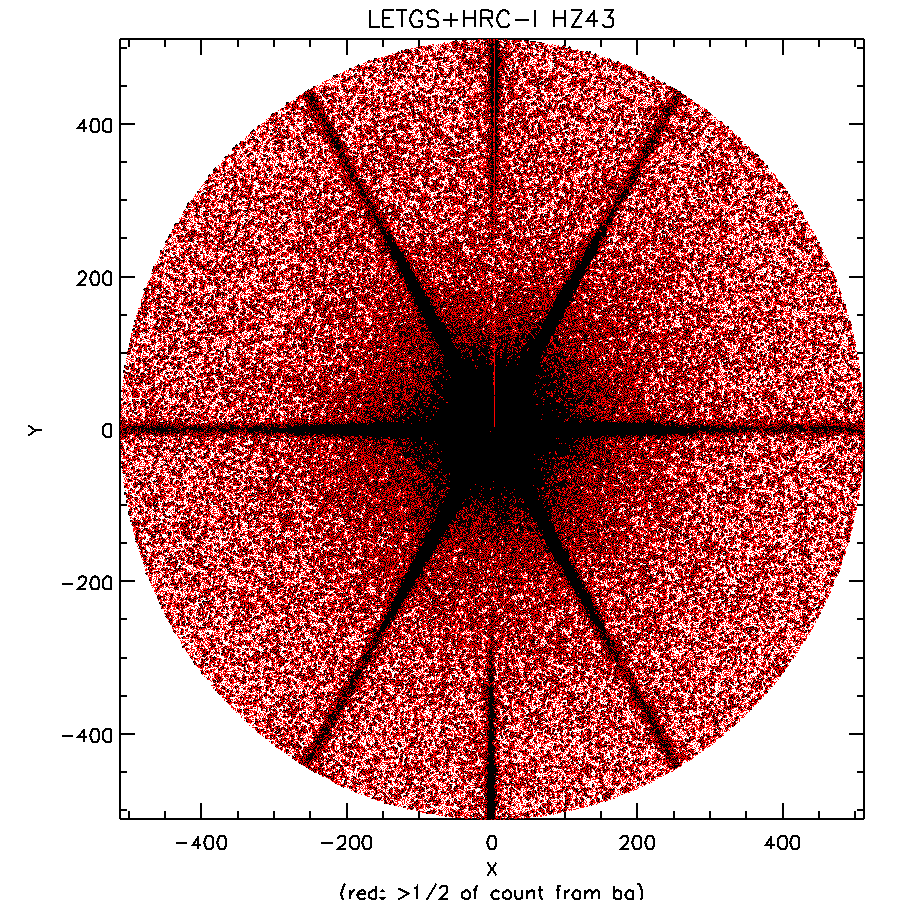 |
| Background per pix estimated from large distances, then area corresponding to each photon is computed via Voronoi Tesselation, and expected contribution of background to that cell is computed; the photon is flagged as a background event if >½ count is attributable to the background. |
Fig B.2: Radii at different EE levels
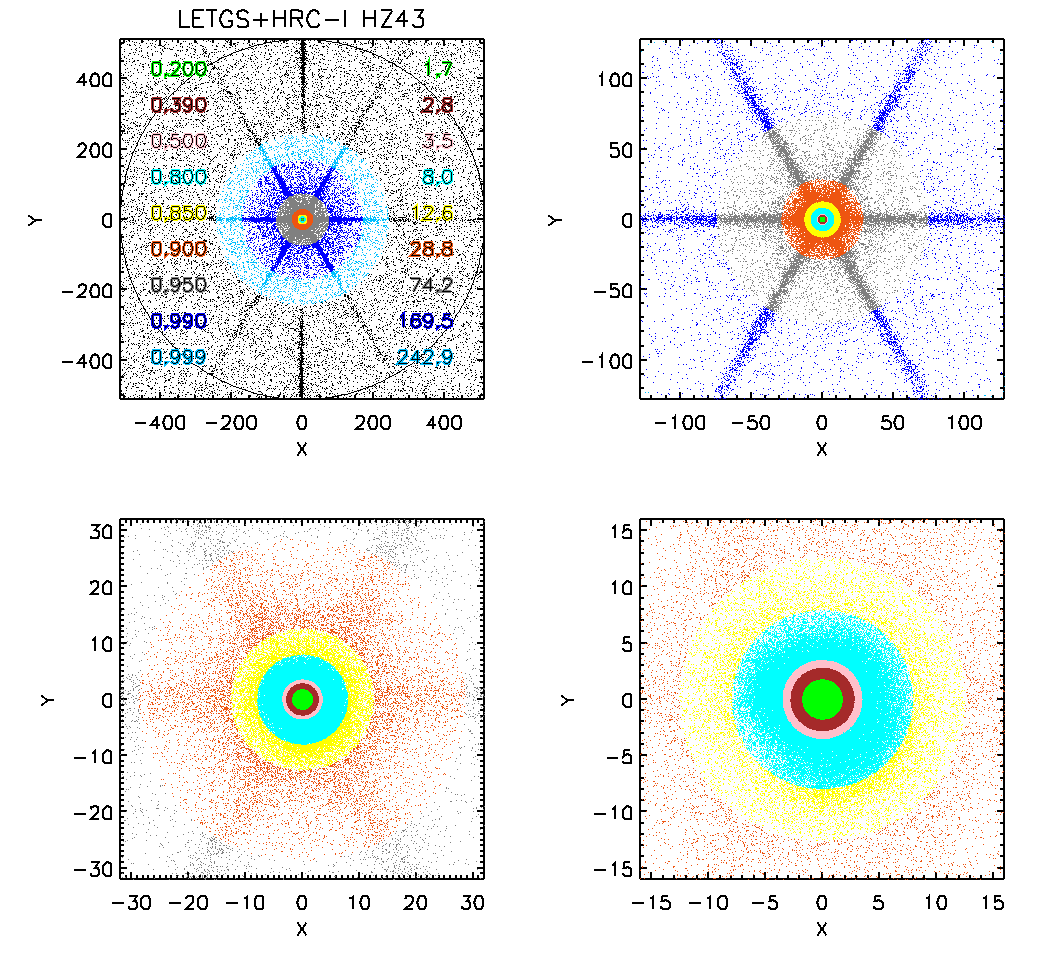 | 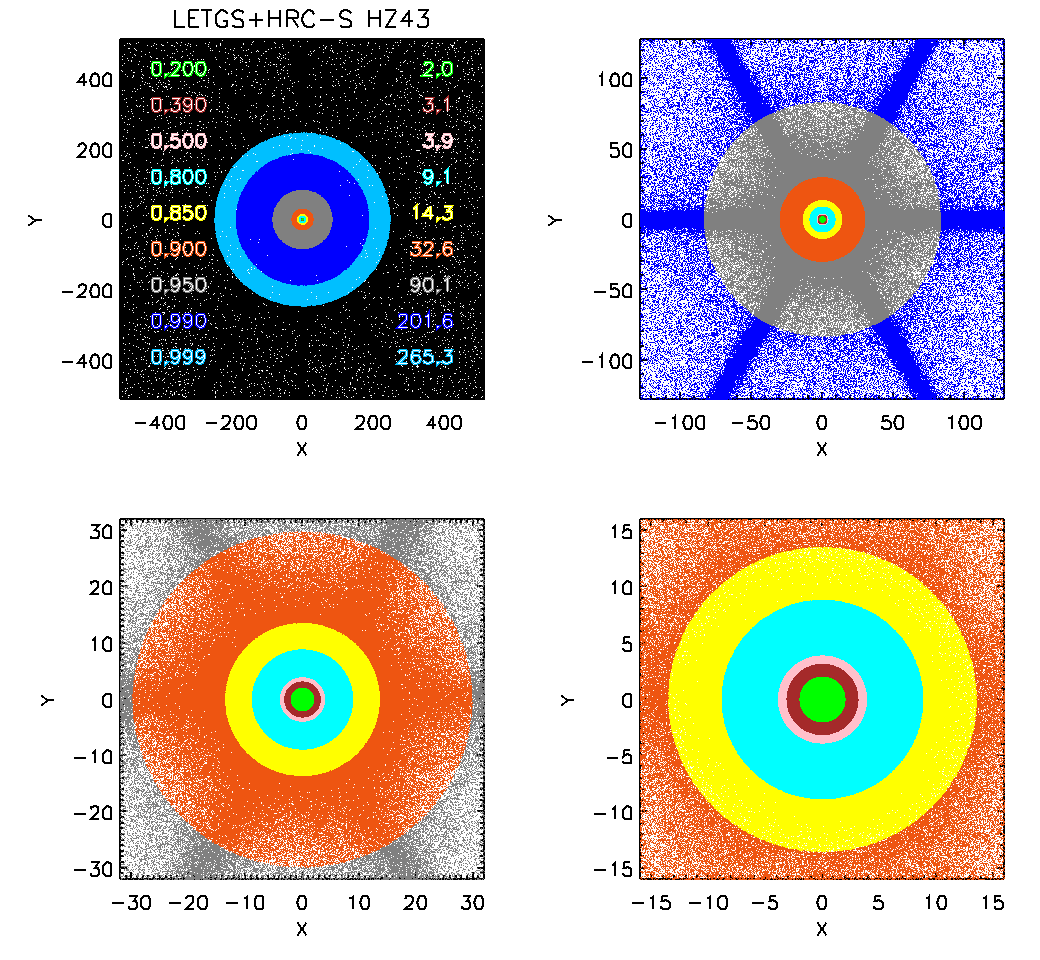 |
| Description here |
- 2018-may-16: document.start()
- 2018-jul-18: circulated
- 2020-jun-16: supplanted by Version 12
Vinay Kashyap (CfA/CXC)


