Monitoring HRC QE and Gain
HRC-I QE
HZ 43

these are 0th order count rates.
best fit line is y= (-4.24e-4 +/- 4.15e-4) t + (3.65 +/- 0.03)
mean rate is 3.62 with standard deviation 0.04. mean of errors is 0.05.
Note that the best fit slope is consistent with zero.
Cas A
Extraction region=1.5"
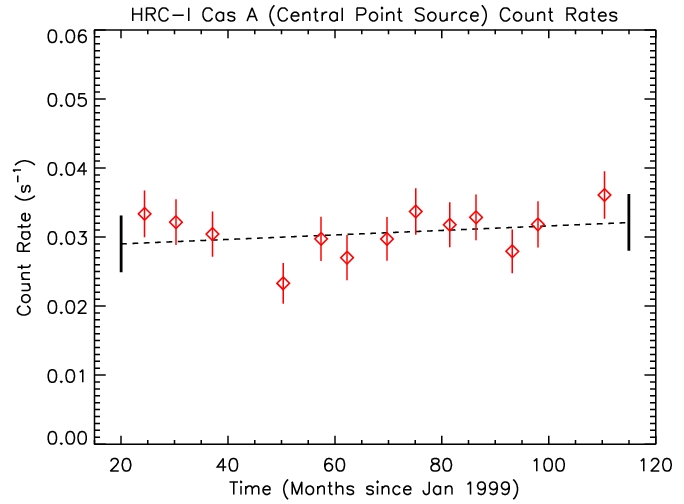
best fit line is y= (3.27e-5 +/- 3.57e-5) t + (0.028 +/- 0.003)
mean rate is 0.031 with standard deviation 0.003. mean of errors is 0.003.
Note that the best fit slope is consistent with zero.
G21.5-0.9
Extraction region=43"
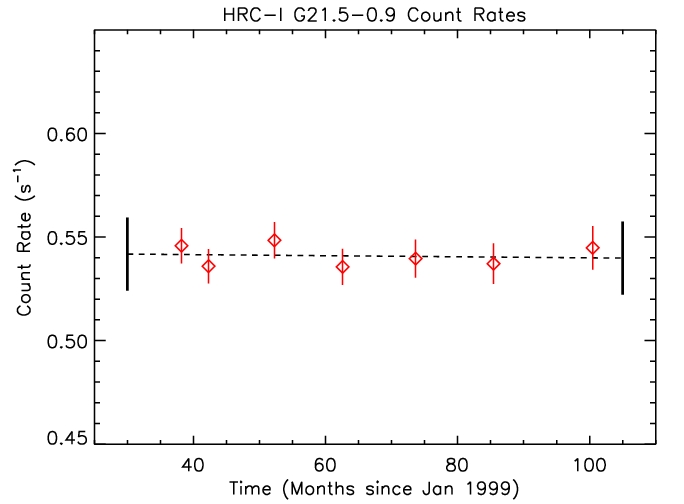
best fit line is y= (-2.58e-5 +/- 1.68e-4) t + (0.54 +/- 0.01)
mean rate is 0.541 with standard deviation 0.005. mean of errors is 0.009.
Note that the best fit slope is consistent with zero.
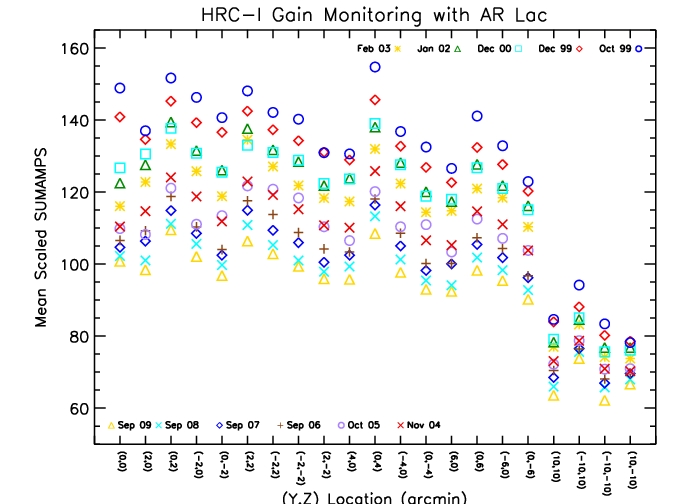
HRC-I Gain
AR Lac
HRC-S QE
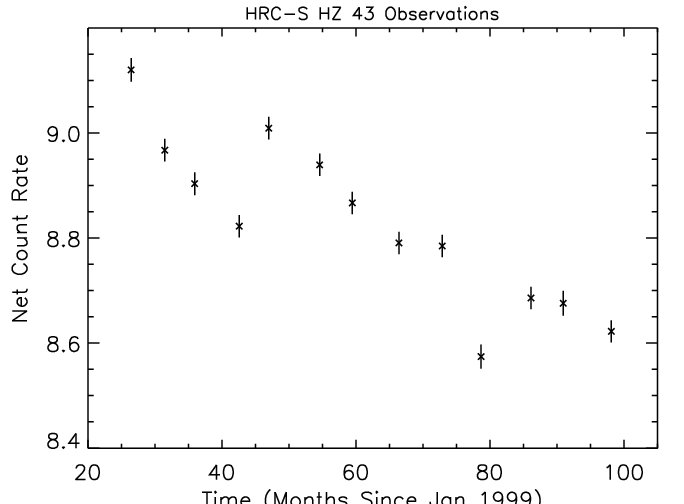
HZ 43
Data processing:
- Obsids 01011, 01012, 02584, 02585, 03676, 03677, 05042, 05044,
05957, 05959, 06473, 06475, 08274
- reprocessed with CIAO 4.1.1 and CALDB 4.1.2
- filter out times with total rate > 150 cts/s
- source region = circle with radius of 50 pixels (6.59")
- background region = two rectangular regions (each 200x600 pixels) above and below the dispersed events and to the left or right of the cross-dispersed events
G21.5-0.9

Linear fit results:
- slope = -3.20x10^-4 +/- 7.988x10^-5 cts/s/month
- offset = 0.508 +/- 0.004 cts/s
- reduced chi-sq = 1.02
Data processing:
- Obsids 00147, 00146, 00148, 01557, 01558, 02868, 02875, 02755, 03695, 03702, 06073, 06743, 08374
- reprocessed with CIAO 4.1.1 and CALDB 4.1.2
- filter out times with total rate > 150 cts/s
- source region = circle with radius of 43 arcseconds
- background region = annulus from 100 to 160 arcseconds
- 2 blue points are subarray mode and have different background regions
HRC-S Gain
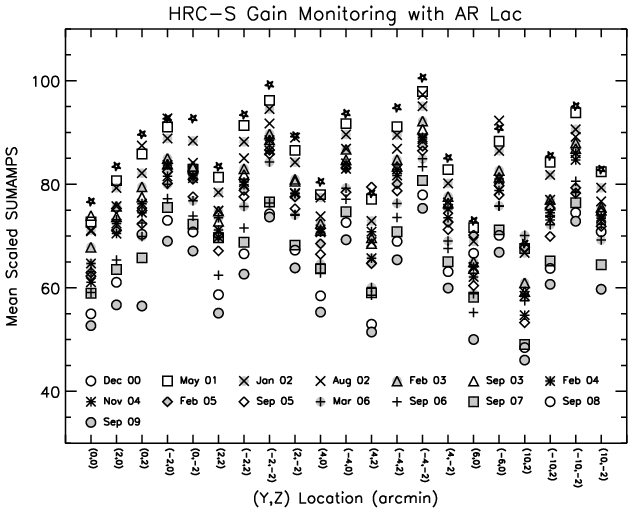
AR Lac
Comments to cxccal (at) cfa.harvard.edu
Last modified: 09/25/12


