

|

|
For each position, we extracted a region of the detector centered on the source image with a radius of 700 pixels (just less than 1.5 arcminutes radius). Within this extracted area the local background was measured at radii large enough to exclude the source and its "ghost" for both the filtered and unfiltered data. These backgrounds were then subtracted from the total counts in each region, giving the source counts before and after filtering at each position. The ratio of these two numbers is shown in the figure below. Note that in this analysis the "ghost" events are considered to be from the source and not the background.

Given that the "ghost" image accounts for approximatly 1-2% of the source photons (see Murray memo), the overall impact on the source in the current configuration is quite small. Overall less than 5% of the source flux is removed and typically only 2% is removed from the core of the PSF. In the Launch configuration (until October) and then after the adjustment of the High Voltage (October to December) the losses are somewhat higher (up to 14%).
In order to analyze the effects of the instrument profile changes on the character of the source events (event PHA and amp_sf values), we have further limited the extracted source region such that only those events within a radius of 500 pixels of the source centroid were included. Within this limited region the source strongly dominates the total count rate (96.4% and 97.8% of the events for the unfiltered and filtered cases).
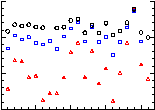
The mean PHA results clearly demonstrate the lowering of the high voltage that occured in October. There is also little to no change in the PHA after the range switch reset in December. The magnitude of the effect on the mean PHA of the H-test filter is of the correct magnitude(e.g. a mean PHA of 156 becomes 152) to be produced solely by the removal of the included background events which typically have a PHA value of channel 255. This indicates that the H-test filter does not change the PHA distrubtion of the soruce events in any appreciable way.
The variation of the mean PHA that is seen is due to local variations in the gain as well as the overall gain structure which rolls of from the center of the detector towards the edges. The last four locations on the plate (#'s 18, 19, 20 and 21) are all located at the extreme edges of the detector and would be expected to have significantly lower gain and thus mean PHA's than the center (location #1).
| Mean PHA | Percentage of AMP_SF=3 events |
|---|---|

| 
|
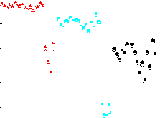
Events at the detected using the least sensitive gain setting (a.k.a. amp_sf=3) also show the expected correlations with the change in the instrument profile, with the adjustment of the range switch in December affecting the larger change. As with the mean PHA there is very little change in the source distribution of amp_sf=3 events due to the H-test filtering, and the point-to-point variations are due primarily to the gain structure of the detector.
Preliminary results on the encircle energy also show that the PSF is not affected in any appreciable way by the use of the H-test filtering.
These analyses confirm the IPI team's results indicating that use of the H-test, with the positive outcomes of reducing the background count rate and eliminating the source "ghost", does not have any significant negative impact on the imaging and photometric properties of the HRC-I.
Contributors:
CXC Calibration Team
HRC IPI Team
 |
The Chandra X-Ray
Center (CXC) is operated for NASA by the Smithsonian Astrophysical Observatory. 60 Garden Street, Cambridge, MA 02138 USA. Email: cxcweb@head.cfa.harvard.edu Smithsonian Institution, Copyright © 1998-2004. All rights reserved. |
Last modified: 09/25/12