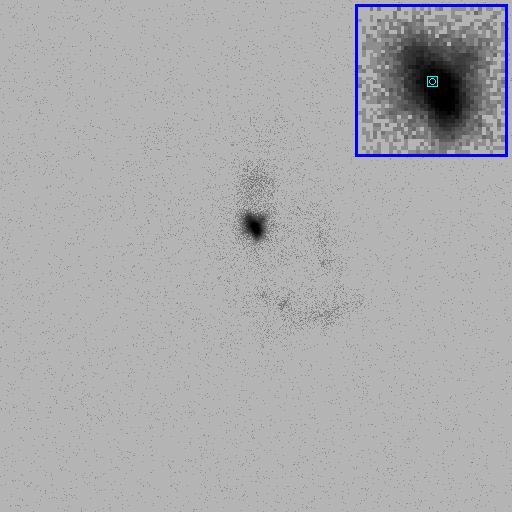

This image was taken with the HRC-I almost in focus and is about a 20ksec observation. During the observation about 20% of the time was during very high background. This high background data was not cut from the image nor the analysis. It looks like increased diffuse background all across the HRC detector. The image is shown in HRC coordinates and is blocked in two HRC pixels per display pixel (i.e, about 1/4 arc second per display pixel). The color map is log.

This is the ChiSq plot from a period folding algorithm. The starting period was 0.0505 seconds and the period bin was 2x10⁻⁸ seconds. The peak ChiSq is in bin 163 (about 490) and that corresponds to a period of 0.050508 sec which is very close to the known period for PSR0540-69. No corrections for S/C motion or Terrestial motion have been made for this test.

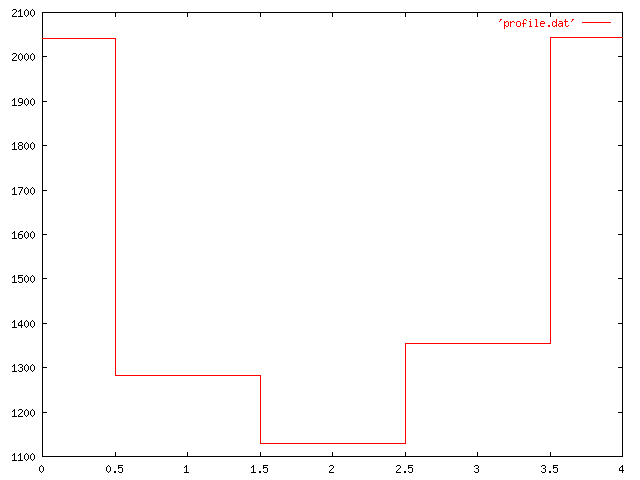
This is the pulse profile, binned only in five phase bins. The pulse shape was know to be sinusoidal and this shape is recovered. Also the pulse fraction is seen to be about 50% which is twice that observed previously (ROSAT). This is likely due to the better angular resolution that permits discrimination from the nebula.
This analysis is all quicklook and was done with the help of Fred Seward who knows a lot about pulsars and finding them in the data! The qualitative aspects of these results are certainly correct, but the quantitative details are bound to change slightly with fully processed data products.
SSM 9/13/99