
These are the HRC-I plate focus images of AR Lac. Defocus values are -0.577, -0.824, -1.070, -1.313, -1.554, -1.793, -2.030, -2.264, & -2.496 mm.
These are the same images, filtered to exclude data with amp_sf values of 3. About 2/3 of the total data is rejected by this criteria.
AR Lac plate focus images again, with only amp_sf = 3 data displayed.
The data were analyzed with the standard focus software, described here. The version modified for use with the HRC is findFocus_hrc.pro; the current batch file used to run the software is focus_hrc_batch.pro.
The results of the plate focus analysis on the amp_sf filtered data are found here. Encircled energy and ACF plots are shown below. The best focus from the ACF fit is
-1.398 mm +/- 0.039.
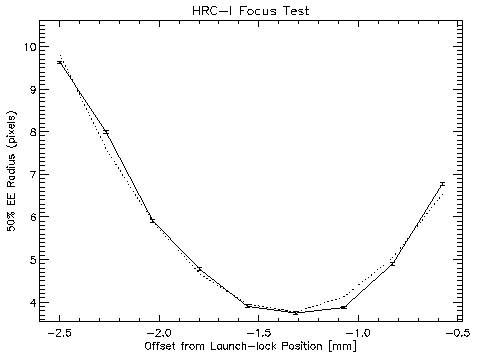 50% EE |  75% EE |
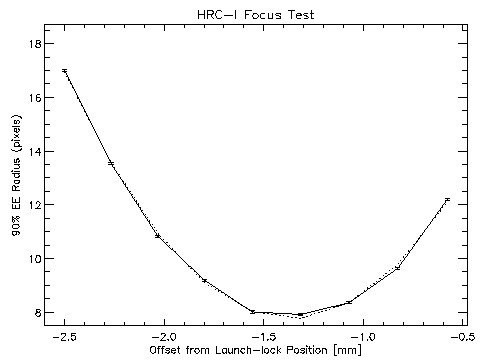 90%EE | 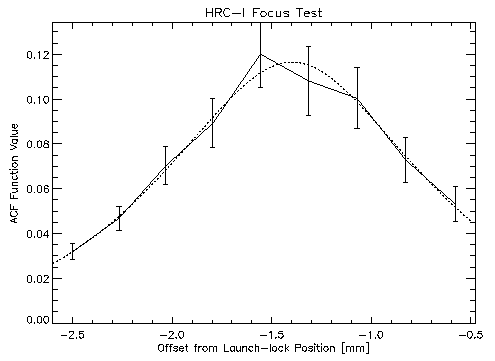 ACF fit |
The results of the plate focus analysis of all the data is found here.
Encircled energy and ACF fit plots are shown below.
The best focus from the ACF fit is -1.273 mm +/- 0.026.
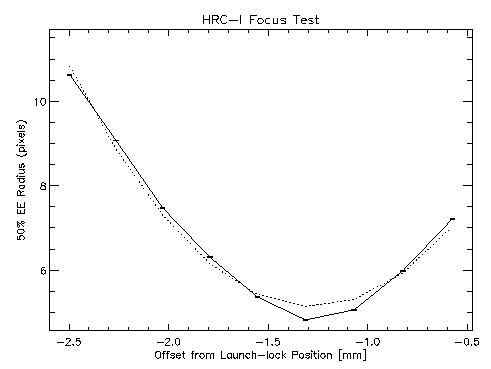 50% EE | 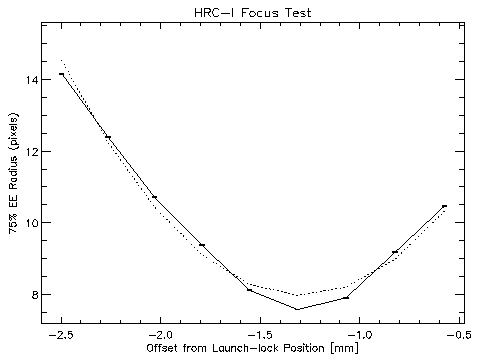 75% EE |
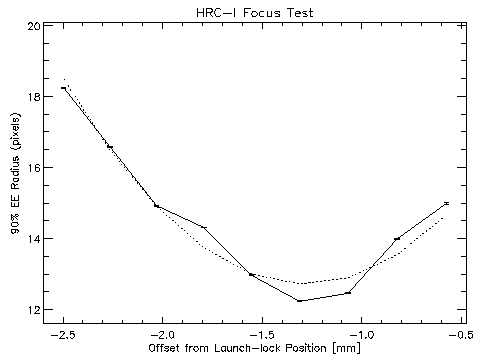 90%EE | 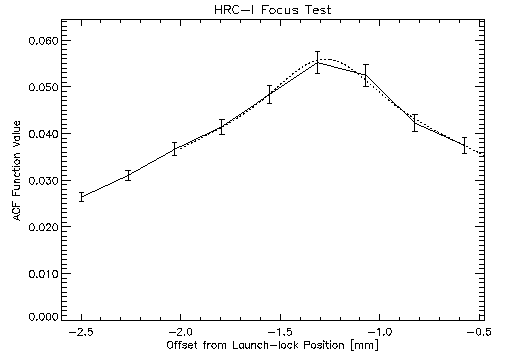 ACF fit |